ngx-graph, an Angular component for directed graphs
Graph visualization library for angular
At a glance
- What is it?
- ngx-graph renders node and link diagrams inside an Angular application as SVG, with dagre layouts, clusters and fully overridable node, link and cluster templates. It is a Swimlane project on MIT licence, built against Angular 22 and the d3 packages.
- Who is it for?
- ngx-graph fits Angular teams that need a workflow, dependency or ownership diagram rendered in the app, with data coming from the same TypeScript models as the rest of the product and a template layer for visual consistency. It does not fit a team outside Angular, and it does not fit a graph editor, since the component renders a graph you supply rather than one the user drags together.
- Can I use it commercially?
- Yes. MIT is a permissive licence: you can use, modify and sell software built on it, as long as you keep its copyright and licence notices.
- Is it still maintained?
- Yes. The repository last received commits 102 days ago.
- What is it written in?
- Mainly TypeScript, according to GitHub's language statistics.
Answers come from the project's GitHub data, last synced on November 7, 2026, and from our analysis. They are not legal advice.
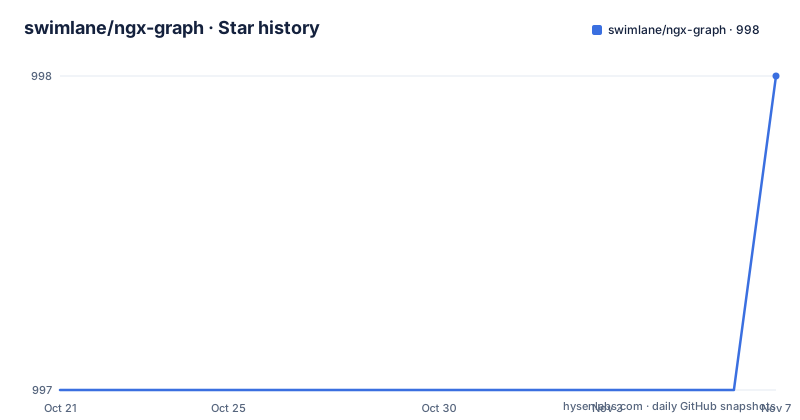
Star history
- swimlane/ngx-graph998 ★ · +1
| Repository | 2026-10-21 | 2026-11-07 |
|---|---|---|
| swimlane/ngx-graph | 997 | 998 |
1 Stars in the last 17 days, measured from the daily GitHub snapshot. Compare with other projects
Editorial analysis
A graph component for Angular apps, not a graph library for the web
ngx-graph is a Swimlane open source project for rendering graphs inside Angular applications. The audience is narrow and specific: a team building a workflow screen, a dependency view, an ownership map or any other node and link diagram inside an Angular product, who wants the diagram to look like the rest of the application rather than like an embedded canvas from another tool. The component is called ngx-graph, you import NgxGraphModule into your module, and you place the component in a template. Rendering is SVG, so nodes and links are real DOM elements rather than a rasterised picture, which is what makes the template override story work. The repository topics name the intended ground: angular, dag, directed-graph, workflow, data-viz and svg. The homepage is a documentation and demo site at swimlane.github.io/ngx-graph, the licence is MIT, and the primary language is TypeScript. The README notes that the project is shared because Swimlane believes in giving back to the open source community, and the package is published from that same repository.
Nodes, links and clusters are plain data you pass in
The data contract is simple enough to read in one sitting. Nodes carry an id and a label, links carry an id, a source, a target and an optional label, and clusters group nodes by listing their ids:
[
  {
    id: 'cluster0',
    label: 'Cluster node',
    childNodeIds: ['2', '3']
  }
];
The component takes those as the links, nodes and clusters inputs, along with a view array that sets the drawing area, and it emits a select event when a node is picked. A minimal usage in a template looks like this:
<ngx-graph
  class="chart-container"
  [view]="[500, 200]"
with the links and nodes arrays bound the same way, and a select handler bound to onNodeSelect. Layout is chosen by an input as well, and the documentation example uses dagreCluster, so a clustered dagre layout is one of the options the library exposes. The important design consequence is that the graph is derived from your application state. The ids in your links have to match the ids in your nodes, and the childNodeIds in a cluster have to match nodes that exist, otherwise the layout has nothing to attach to and the rendering degrades quietly rather than throwing.
Every visual element can be replaced with an ng-template
The component is not a fixed picture. The README's custom templates example overrides the defs, the cluster, the node and the link, each through an ng-template, and the rendered output is SVG that you control. The defs template is where you define markers such as an arrowhead:
  <ng-template #defsTemplate>
    <svg:marker id="arrow" viewBox="0 -5 10 10" refX="8" refY="0" markerWidth="4" markerHeight="4" orient="auto">
      <svg:path d="M0,-5L10,0L0,5" class="arrow-head" />
    </svg:marker>
  </ng-template>
The node template receives the node and reads computed values such as node.dimension.width, node.dimension.height and node.data.color, and it can carry Angular bindings, which is how the example wires a tooltip through ngx-tooltip with a placement and a title taken from the node label. The link template renders the path and a label along it using a textPath bound to the link id, with the dominant baseline taken from the link object. The cluster template receives the cluster and reads cluster.dimension and cluster.data.color the same way. This is the strongest argument for the library: your graph inherits your design system, because the shapes are your own templates.
Installing the package, and running the Storybook while you work on it
For consumers the install is a single npm call, and the README lists the three steps that follow it:
npm install @swimlane/ngx-graph --saveImport NgxGraphModule into your module, then use the ngx-graph component in your components. For people who want to work on the library itself, the README asks you to clone a fork of the repository and run yarn, and the package scripts show what the workspace offers:
  "scripts": {
    "ng": "ng",
    "start": "ng run @swimlane/ngx-graph:storybook",
    "build:storybook": "ng run @swimlane/ngx-graph:build-storybook",
    "build:lib": "ng build @swimlane/ngx-graph --configuration production",
    "test": "ng test @swimlane/ngx-graph --no-watch",
    "test:watch": "ng test @swimlane/ngx-graph",
The README explains that yarn start serves Storybook at http://localhost:6006/, and that Storybook is the development and test environment for the library. yarn build:lib produces the library and yarn build:storybook builds Storybook into the dist/ directory to check for production issues. One documentation wrinkle is worth knowing before you rely on it: the README says yarn test executes the linter, while the package script maps test to the Angular test runner with no watch, and a separate lint script runs ng lint. The full CI script runs lint, prettier:ci and test together.
Releases are cut by hand, and the repository records no GitHub releases
The maintenance picture here is unusual enough to state plainly. The repository has no GitHub releases, and the last push was on 2026-07-29. The changelog lives in CHANGELOG.md in the repository root, and the npm package is what gets published. The README documents the release procedure as a manual checklist: check out master, pull, run the CI script, read the log to determine the next version number, create a branch named release/X.Y.Z, update the version in projects/swimlane/ngx-graph/package.json, update the changelog, run yarn package to check the package format, commit, tag, push the tags, run yarn publish:lib, and submit a pull request. The publish script pushes the built package from dist/ngx-graph, and a separate script copies README.md, LICENSE and CHANGELOG.md into that folder so the published tarball carries the same documents. The dependency set is telling about the direction of travel: the package pins Angular packages around version 22.0.8, plus @angular/cdk, @angular/flex-layout and a set of d3 packages including d3-force, d3-selection, d3-scale, d3-shape, d3-timer and d3-dispatch. So expect a version bump whenever your Angular workspace moves, and expect the library to follow the framework's release cycle rather than its own.
Where ngx-graph is the wrong tool
The first limit is the framework. This is an Angular component in an Angular workspace, published as an Angular library, with its peer dependencies pinned to a specific Angular generation. A React or Vue team gets nothing from it, and an Angular team on an older framework version has to wait or fork. The second limit is that it renders rather than edits. The component consumes nodes, links and clusters that your code already holds, and emits a select event, which is exactly what a read-only visualisation needs and exactly what a graph editor does not. Building drag-to-connect on top means handling pointer events and mutating your own model yourself. The third is scale, and the README is quiet on it: with SVG output, one element per node and per link, a very large graph produces a very large DOM, and the library publishes no guidance on how many nodes it handles well. The realistic alternative for a team willing to own the plumbing is to skip the Angular component and render the same d3 packages directly, d3-force for a force layout, d3-selection for the DOM, with a graph library, which buys you full control of the interaction model and drops the Angular coupling, the template layer and the upgrade work that comes with it.
Editorial conclusion
ngx-graph fits Angular teams that need a workflow, dependency or ownership diagram rendered in the app, with data coming from the same TypeScript models as the rest of the product and a template layer for visual consistency. It does not fit a team outside Angular, and it does not fit a graph editor, since the component renders a graph you supply rather than one the user drags together. Before adopting, run yarn start to see the Storybook examples on port 6006, check the peer dependency range against the Angular version in your workspace, and read the release checklist in the README, since versions are cut by hand into projects/swimlane/ngx-graph/package.json.
Frequently asked questions
How do I install ngx-graph?
Run npm install @swimlane/ngx-graph --save, import NgxGraphModule into your module, then use the ngx-graph component in your components, binding the nodes and links arrays and the view size.
Can I change how nodes, links and clusters are drawn in ngx-graph?
Yes. The README's custom templates example overrides the defs, cluster, node and link rendering through ng-template, so you can supply your own SVG shapes, colors and bindings for each element type.
What layouts does ngx-graph support?
The layout is selected by an input on the component, and the documented example uses dagreCluster, a clustered dagre layout. The repository also depends on the d3 packages, including d3-force.
How do I work on ngx-graph locally?
Clone a fork of the repository and run yarn, then yarn start to serve Storybook at http://localhost:6006/, which the README describes as the development and test environment for the library. yarn build:lib builds the library and yarn build:storybook builds Storybook into dist/.
How are ngx-graph releases published?
By hand, following the checklist in the README: run the CI script, bump the version in projects/swimlane/ngx-graph/package.json, update CHANGELOG.md, tag the commit and run yarn publish:lib. The repository itself records no GitHub releases, and the last push was on 2026-07-29.
Official sources
Add this badge to your README
If you maintain this project, the badge below links readers to this analysis and shows its maintenance status from the daily GitHub snapshot. Paste the markdown into your README; add ?metric=license or ?metric=stars to the image URL for a different field.

[](https://hysenlabs.com/projects/swimlane-ngx-graph)Star history chart for your README
[](https://hysenlabs.com/projects/swimlane-ngx-graph)Was this useful?