The Economist Big Mac Data: Reproducing the Big Mac Index
Data and methodology for the Big Mac index
At a glance
- What is it?
- TheEconomist/big-mac-data publishes the CSV and Excel data behind The Economist’s Big Mac index, along with R notebooks and scripts that show how raw and GDP-adjusted values are produced. It is useful for researchers who need the published methodology and source fields, but the repository treats notebook setup as the reader’s responsibility.
- Who is it for?
- Adopt this repository when you need The Economist’s Big Mac index files, source variables, or calculation code for analysis and teaching. Do not treat it as a turnkey application or as a fully current cross-platform setup guide, because Windows instructions are unfinished and the documented dependency commands include dated Python and Ubuntu guidance.
- Can I use it commercially?
- Yes. MIT is a permissive licence: you can use, modify and sell software built on it, as long as you keep its copyright and licence notices.
- Is it still maintained?
- Yes. The repository last received commits 96 days ago.
- What is it written in?
- Mainly Jupyter Notebook, according to GitHub's language statistics.
Answers come from the project's GitHub data, last synced on November 6, 2026, and from our analysis. They are not legal advice.
Star history
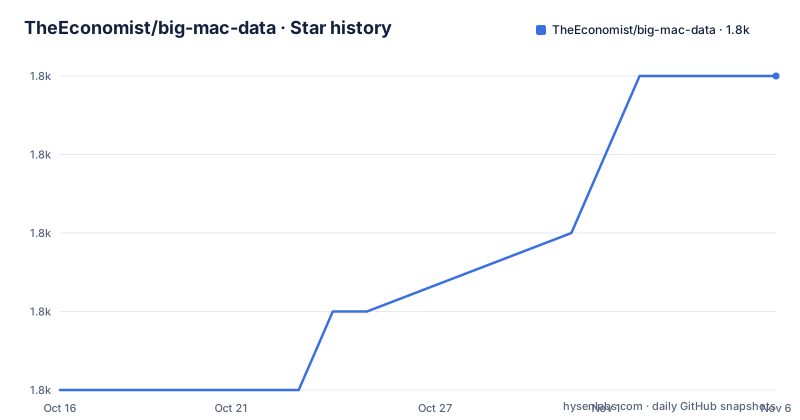
- TheEconomist/big-mac-data1,754 ★ · +4
| Repository | 2026-10-16 | 2026-11-06 |
|---|---|---|
| TheEconomist/big-mac-data | 1.8k | 1.8k |
4 Stars in the last 21 days, measured from the daily GitHub snapshot. Compare with other projects
Editorial analysis
What The Big Mac Data Repository Contains
TheEconomist/big-mac-data is the data and methodology repository for The Economist’s Big Mac index. It is aimed at people who want to inspect the underlying observations, reproduce the calculation, or work with the resulting indicators in a notebook or spreadsheet. The repository description identifies Jupyter Notebook as the primary language, while the README explains that the calculation code itself is written in R. The repository contains the notebook named `Big Mac data generator.ipynb`, several versions of R data-generation scripts, an Excel generation script, and directories for input and output data.
The published outputs are divided into three CSV files. `big-mac-raw-index.csv` contains the raw index, `big-mac-adjusted-index.csv` contains the GDP-adjusted index, and `big-mac-full-index.csv` contains both. The README also says that users can download the index data in CSV or Excel from the latest release. Those files are not merely a single calculated score. They include source data used to calculate the index, including the local Big Mac price, exchange rate, dollar price, GDP per person, and an adjusted price.
The repository therefore serves two related needs. A reader can download a structured dataset without running any code, or a reader can inspect and execute the R workflow that produced it. It is a research data project rather than a packaged command-line application. No library API, service endpoint, or scheduled data service is documented.
How The Raw And Adjusted Indices Are Calculated
The codebook describes the data flow from local prices to index values. Each observation includes `local_price`, the price of a Big Mac in local currency, and `dollar_ex`, the number of local currency units per dollar. The derived `dollar_price` converts the local price into dollars. The raw index compares the dollar price with the United States reference price, while separate raw fields express values relative to the US dollar, euro, British pound, Japanese yen, and Chinese yuan.
The adjusted series adds GDP information. The README states that the July 2022 methodology stopped using the IMF’s calculation of purchasing-power parity for the GDP adjustment. Instead, it adjusts GDP per person by the difference between each country’s Big Mac price. The resulting `adj_price` is described as the GDP-adjusted price of a Big Mac in dollars, and the adjusted index fields provide corresponding values against the same reference currencies.
The method has a notable revision boundary. The repository documentation says that the full history of the GDP-adjusted series is updated whenever the IMF’s historical GDP series are updated. Consequently, a historical adjusted value can change slightly when IMF measurements are revised. This is not a fixed historical snapshot. The repository also states that the United States price changed in July 2022 from an average of prices in four major US cities to a McDonald’s-provided price. Older versions of both indices remain available through releases, which matters when reproducing a published number or comparing methods across time.
Data Fields And Source Boundaries
The output files are useful partly because they expose the variables behind each index value. `date` identifies the observation, `iso_a3` provides a three-character ISO 3166-1 country code, `currency_code` provides a three-character ISO 4217 currency code, and `name` identifies the country. The README attributes Big Mac prices to McDonald’s and The Economist, exchange rates to Thomson Reuters through January 2022 and Refinitiv Datastream from July 2022, and GDP and population inputs for euro-area averages to Eurostat. GDP per person comes from IMF World Economic Outlook reports.
The suffix convention can cause confusion. In the full file, variables carry `_raw` or `_adjusted` suffixes. In the corresponding standalone raw and adjusted files, those suffixes are omitted. A reader who combines files programmatically should account for this naming difference rather than assuming that `USD_raw` in the full file has the same name as `USD` in the raw file.
The repository does not claim to provide a fully automated live feed. The README directs readers to the latest release for downloadable data and identifies historical releases for previously published versions. It also does not document a formal validation suite, test command, or schema-checking process. The available evidence supports using the files as published research data and inspecting the notebook when exact methodology matters, but it does not support claims about automatic refreshes or guaranteed reproducibility across every environment.
Installing The Notebook Environment
The README’s setup path is for running the R code through Jupyter. It recommends Python 3, Jupyter, R, IRkernel, and the R packages `tidyverse` and `data.table`. The documentation gives commands for macOS and Ubuntu, but marks Windows instructions as “coming.” It also describes an Ubuntu package command for `python3.6` and uses an Ubuntu repository configuration containing `xenial`, so the setup guide is dated and should be checked against the current operating system before being copied into automation.
On macOS, the README first shows the Homebrew installation command, then shows the Python and R installation commands:
$ /usr/bin/ruby -e "$(curl -fsSL https://raw.githubusercontent.com/Homebrew/install/master/install)"
$ brew install python3
$ brew install R
The first command installs Homebrew, the second installs Python 3, and the third installs R. After Python is available, the README gives the Jupyter installation command:
$ python3 -m pip install jupyterOn Ubuntu Linux, the documented Python and R installation commands are:
$ sudo apt-get update
$ sudo apt-get install python3.6
$ sudo apt-get install r-base
The README also requires adding the CRAN repository before installing R on Ubuntu. It documents that setup in separate commands, including the `sudo add-apt-repository` command shown in the README. Because these instructions target older package names and a specific Ubuntu distribution, an engineer should treat them as a historical starting point rather than assume they represent supported current packages.
IRkernel connects R to Jupyter. The README’s R installation sequence is:
> install.packages(c('repr', 'IRdisplay', 'evaluate', 'crayon', 'pbdZMQ', 'devtools', 'uuid', 'digest'))
> devtools::install_github('IRkernel/IRkernel')
> IRkernel::installspec()
Finally, the notebook uses additional R packages:
> install.packages(c('tidyverse','data.table'))The package installation commands are shown exactly as documented. The README does not pin package versions, so the article cannot infer which dependency versions reproduce a particular release.
Running The Big Mac Data Generator Notebook
After installing Jupyter and the R kernel, the README instructs the reader to navigate to the repository directory and start the notebook server:
$ jupyter notebookJupyter should open `http://localhost:8888` in a browser. The README says to click “Big Mac data generator” to launch the notebook. The calculation can then be run cell by cell with `shift`+`enter`. That execution order matters because a notebook may read source files, derive fields, and write output data in sequence. The repository layout includes `source-data/` and `output-data/`, but the README excerpt does not document every path expected by every notebook cell or describe how missing source files are handled.
The repository also includes `data-generator.R`, `data-generator-v2.R`, `data-generator-v3.R`, and `generate-excel.R`. Their presence indicates that the notebook is not the only executable artifact in the repository. However, the README specifically directs users to the notebook for calculating the index. It does not give a single command that identifies one script as the canonical current entry point, nor does it document a test suite that would compare a rerun against a published release.
For a first real use, the safest documented workflow is therefore straightforward: start `jupyter notebook`, open `Big Mac data generator.ipynb`, and execute its cells in order. A researcher who only needs the published values can instead download the CSV or Excel files from the latest release. This is not the same operation. The downloaded release is an input for analysis, while running the notebook attempts to reproduce the calculation from the repository’s data and dependencies.
Limitations Of The Repository As A Reproducibility Tool
The main limitation is environmental rather than conceptual. The notebook is written in R, but the documented execution path requires Python, Jupyter, IRkernel, and several R packages. The README provides no Windows installation instructions, and it gives older Ubuntu guidance that includes `python3.6` and `xenial`. A reader on another platform may need to translate the setup without relying on a project-specific Windows procedure.
Dependency versions are also absent from the instructions. The README names packages but does not give a lockfile, package version matrix, or pinned container image. Consequently, the same notebook may behave differently if package behavior changes or if the local environment uses newer R and Python releases. The repository’s MIT license permits reuse and modification under that license, but the license does not by itself guarantee that dependencies remain available or that an environment can be recreated exactly.
Another limitation concerns interpretation. The Big Mac index is a price-based comparison built from a particular product and a particular source collection process. The README does not document uncertainty intervals, confidence tests, or a statistical significance procedure. It also does not claim that the index measures every aspect of purchasing power, wages, or economic welfare. Researchers using it for policy or forecasting work should preserve the distinction between the raw comparison and the GDP-adjusted series, and should record which release and methodology version they used.
When To Use The CSV, Excel, Or R Notebook
The release CSV and Excel files are the practical choice when the task is to load published observations into an analysis environment, build a chart, or inspect the variables documented in the codebook. The full CSV is useful when both raw and adjusted measures are needed in one table. The separate raw and adjusted files reduce irrelevant columns for workflows that only consume one series.
The notebook or R scripts are the better choice when a researcher needs to understand the calculation or reproduce a file from repository inputs. That choice comes with higher setup cost and more dependency risk because the calculation is embedded in a notebook and R environment rather than exposed as a small documented library. The README does not provide a command-line interface for selecting a date range, exporting a custom subset, or scheduling updates.
A direct alternative for some readers is to consume the latest release file without executing the notebook. That avoids Python, Jupyter, IRkernel, and R package installation, but it does not reproduce the methodology. Another alternative is to use an existing economic dataset for cross-country purchasing-power analysis, then compare its definitions and inputs with this repository before combining results. The README does not claim compatibility with any particular external dataset, so that comparison must be made explicitly rather than inferred.
Maintenance, Releases, And Upgrade Costs
The repository is not archived, and the last recorded push was on 2026-08-04. The release history includes `2025-01`, dated 2025-02-18, `2024-07`, dated 2024-08-05, and `2024-01`, dated 2024-05-02. These dates show that releases have carried new data periods, while the repository metadata indicates recent repository activity. The README does not define a formal release cadence, support policy, or long-term compatibility promise.
Upgrade cost depends on the chosen artifact. Downloading a new CSV or Excel file generally requires checking column names, observation dates, and the methodology version. Running the notebook may require adapting Python, Jupyter, R, IRkernel, and package installations to the reader’s platform. The README’s absence of pinned dependency versions makes that environment work part of the upgrade burden. The repository’s MIT license supports reuse and modification, subject to the license terms, but it does not remove the need to retain source attribution and review the license text.
The most important upgrade check is methodological. Since the July 2022 changes affect both the US reference price and the GDP adjustment, a new release should not be treated as a simple append to an old series without reviewing the README’s methodology notes and the relevant release contents.
Editorial conclusion
Adopt this repository when you need The Economist’s Big Mac index files, source variables, or calculation code for analysis and teaching. Do not treat it as a turnkey application or as a fully current cross-platform setup guide, because Windows instructions are unfinished and the documented dependency commands include dated Python and Ubuntu guidance. Verify first that the release notebook and package environment can run on your operating system, then check the methodology change from July 2022 before comparing current adjusted values with older publications.
Frequently asked questions
What is TheEconomist/big-mac-data used for?
It contains the data behind The Economist’s Big Mac index and R code showing how the index is calculated. The outputs include raw, GDP-adjusted, and combined CSV files, with CSV and Excel downloads available from releases.
How do I run the Big Mac data generator?
The README instructs you to install Jupyter, R, IRkernel, `tidyverse`, and `data.table`, then run `jupyter notebook` from the repository directory and open “Big Mac data generator.” Windows installation instructions are marked as coming, so the documented setup is incomplete for Windows.
What changed in the Big Mac index methodology?
In July 2022, the repository changed the United States price from an average of four major US cities to a McDonald’s-provided price. It also changed the GDP adjustment to account for each country’s Big Mac price difference instead of using the IMF’s purchasing-power-parity calculation.
Official sources
Add this badge to your README
If you maintain this project, the badge below links readers to this analysis and shows its maintenance status from the daily GitHub snapshot. Paste the markdown into your README; add ?metric=license or ?metric=stars to the image URL for a different field.

[](https://hysenlabs.com/projects/theeconomist-big-mac-data)Star history chart for your README
[](https://hysenlabs.com/projects/theeconomist-big-mac-data)Was this useful?