Vitest for VS Code: run, debug and watch tests from the editor
VS Code extension for Vitest
At a glance
- What is it?
- The vitest-dev/vscode extension puts Vitest into the Visual Studio Code Testing view through the TestController API, adding per test run and debug actions, coverage, inline console output and an import duration panel. It is versioned in lockstep with Vitest itself and its configuration surface is large enough to need care in monorepos.
- Who is it for?
- Adopt the Vitest extension if your team already runs Vitest and wants test execution, debugging and coverage inside the editor without leaving the Testing view, since it plugs into the standard VS Code test API rather than inventing its own panel. Do not expect it to solve config discovery in a messy monorepo, because it still resolves config files by glob search and the ignore patterns are known to miss layouts that need a manual rootConfig.
- Can I use it commercially?
- Yes. MIT is a permissive licence: you can use, modify and sell software built on it, as long as you keep its copyright and licence notices.
- Is it still maintained?
- Yes. The repository last received commits 39 days ago.
- What is it written in?
- Mainly TypeScript, according to GitHub's language statistics.
Answers come from the project's GitHub data, last synced on November 7, 2026, and from our analysis. They are not legal advice.
Star history
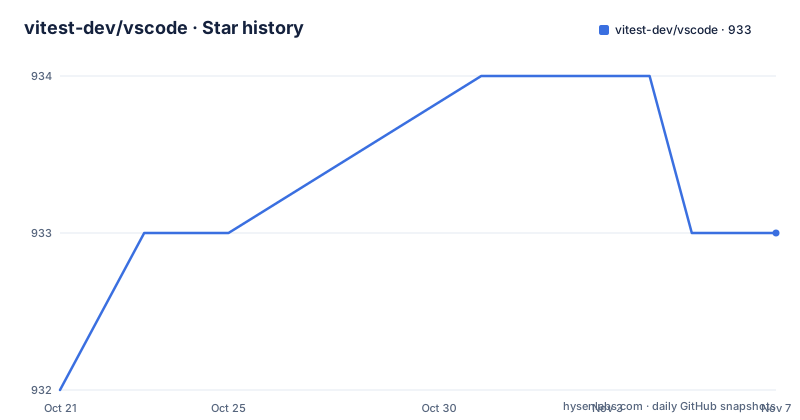
- vitest-dev/vscode933 ★ · +1
| Repository | 2026-10-21 | 2026-11-07 |
|---|---|---|
| vitest-dev/vscode | 932 | 933 |
1 Stars in the last 17 days, measured from the daily GitHub snapshot. Compare with other projects
Editorial analysis
An extension built on the VS Code TestController API
The Vitest extension is published on the Visual Studio Marketplace under the identifier vitest.explorer, and the project site is vitest.dev/vscode. The implementation is TypeScript and the package is published under the name explorer with a display name of Vitest.
The architectural decision worth knowing is that Vitest uses the VS Code TestController API, so the extension contributes to the built in Testing view rather than shipping a panel of its own. That has consequences. Your tests appear alongside tests from any other framework that also uses the API, the same filtering and grouping machinery works, and the standard VS Code guide on running tests applies. It also means the extension inherits the limits of that API, including the fact that a test tree is a tree of files, suites and cases rather than an arbitrary graph.
You can also drive tests from inside a test file. When a test file is open, test icons appear in the gutter next to each test case, and clicking one runs that case. Right clicking the icon opens a context menu with run, debug, run with coverage, reveal in Test Explorer and breakpoint settings.
The package is built with tsdown, bundled to dist/extension.js as a commonjs extension, and packaged with vsce. The repository uses pnpm workspaces, with the samples directory holding around twenty example workspaces that double as manual test cases.
What the Testing view toolbar actually does
The toolbar at the top of the Testing view is where the day to day work happens. Refresh Tests reloads your test suite so that new or renamed tests show up. Run All Tests starts testing all cases that are currently visible, which respects the filter bar, so a filtered view runs only what you are looking at.
Debug Tests starts a debugging session for the tests, and Run Tests with Coverage does the same run while collecting code coverage information for the visible cases. Continuous Run and Stop Continuous Run toggle the watch mode that reruns on file changes. Show Output displays the detailed logs from test executions, which is where you look when a test fails without a useful message. Miscellaneous Settings customises the Testing view itself, with sorting and grouping options.
Status is shown as icons next to each test: a checkmark for passed, a cross for failed, an arrow for skipped, a yellow icon for queued and a dot for not executed.
The filter bar narrows the list by test name, by exclusion pattern, and by tag. Tag filtering is the one that pays off in a large suite, because it lets you slice by a marker you already put in your test names rather than scrolling a flat list of several hundred cases. Hovering or right clicking a folder, file, suite or test reveals further actions.
Inline console output and the import duration panel
Two features go beyond the plain test runner integration, and both are about seeing what happened rather than just whether it passed.
Inline console display puts console logs in the editor next to the code that produced them. For a test that logs and then fails, you no longer have to open the output channel and scan a wall of interleaved lines to find the line that matters. The log sits where you were already looking.
Imports duration displays the execution time for each import during continuous test runs. This is a diagnosis tool rather than a speed feature. When a test suite feels slow, the question is whether the time goes into your code or into the module graph, and a per import timing table answers that directly. Continuous run is where it matters, since that is the mode where you feel the delay on every save.
The third feature, Trace View, opens recorded Vitest 5 browser interactions for a selected test. That is specific to browser mode and to Vitest 5, so it is not something you get with the Node side of a project, but for browser tests it turns a recorded run into something you can step through in the editor.
Config discovery: rootConfig, workspaceConfig and the search globs
This is where the extension is most likely to need help, and the documentation is unusually explicit about it. There are two direct path settings: vitest.rootConfig for the path to your root config file, with a pointer to the Vitest workspace guide if you have several configs, and vitest.workspaceConfig for the workspace config file, of which there can be only one per VS Code workspace.
Three more settings control the automatic search. vitest.ignoreWorkspace skips the workspace resolution step entirely so that only vitest.config files are looked for. vitest.configSearchPatternInclude is the glob used when looking for config files, applied to config files rather than to test files inside configs, and it defaults to a pattern covering vite and vitest config files in the ts, js, mjs, cjs, cts and mts extensions. vitest.configSearchPatternExclude is the glob ignored during that search, defaulting to node_modules, vendor, dot directories and declaration files.
The documentation contains an admission about this mechanism: if the extension cannot find Vitest, open an issue. That is the project telling you the automatic search is not exhaustive.
Path resolution follows the workspace model. Options are resolved relative to the workspace file if there is one, relative to the open folder if you have a single folder, and as given if you have several folders and no workspace file, in which case they need to be absolute.
Runtime and process spawning: node, deno, child_process and terminal
The extension needs to start a Vitest process, and how it does that is configurable, which matters when your environment setup is not plain node on PATH.
vitest.runtime chooses the default runtime, with auto, node and deno supported. In auto mode the extension looks for a deno.enabled config flag or a deno.json file in the root folder, and otherwise uses Node.
vitest.shellType selects the spawning method, either child_process or terminal, with child_process as the default. The terminal option exists for people who set up their environment through a custom shell script, and the documentation notes that when using terminal a websocket connection is established. That is a real behavioural difference, not a cosmetic one, since the websocket carries the test results back.
The related path and argument settings follow from that choice. vitest.nodeExecutable is the path to the Node.js executable, and if it is not set the extension looks for it via PATH or which; it applies only under child_process. vitest.nodeExecArgs and vitest.terminalShellPath and vitest.terminalShellArgs fill in the rest. For debugging, vitest.debuggerPort defaults to 9229 and falls back to a free port if that one is unavailable, while vitest.debuggerAddress is the TCP/IP address of the process to be debugged and defaults to localhost.
vitest.cliArguments passes extra arguments to the Vitest CLI, with an example of a mode flag. Four CLI arguments are explicitly ignored because the extension manages them itself: watch, reporter, api and ui.
Requirements, install and the version coupling with Vitest
The extension is not usable on its own, and the requirements are spelled out. Visual Studio Code version 1.77.0 or newer, Vitest version v1.4.0 or newer, and Node.js 18.0.0 or newer, which the documentation notes follows Vitest. Coverage has its own floor, requiring Visual Studio Code 1.88.0 or newer.
Installation is through the Visual Studio Marketplace. There is no separate CLI to install, and nothing in the repository suggests a manual build and install path for everyday use.
The versioning is the thing to watch. The extension is versioned in step with Vitest itself, with the release list showing v1.52.2 from 2026-09-30, v1.52.1 from 2026-09-25 and v1.52.0 from 2026-09-09, and the package.json version field reads 1.52.2. That coupling means extension and runner upgrades tend to arrive together, and it also means a Vitest upgrade is likely to want a matching extension upgrade rather than an older extension against a newer runner.
The repository is not archived and the last push was on 2026-09-30. The licence is MIT, and the project is sponsored through Open Collective under the Vitest banner.
For anyone working on the extension itself rather than installing it, the build and test entry points live in the package scripts.
    "build": "tsdown --minify --clean",
    "package": "vsce package --no-dependencies",
    "test": "vscode-test",
The extension is bundled with tsdown, packaged with vsce without dependencies, and tested through vscode-test, with a separate end to end script that runs vitest against the test/e2e root.
Where this extension stops being the right tool
Three limits deserve naming.
First, it does not fix configuration discovery. If your monorepo has configs the glob patterns cannot reach, or several workspace roots without a workspace file, the extension will not infer your intent. That is what vitest.rootConfig and vitest.workspaceConfig are for, and setting them is on you. The samples directory includes monorepo-vitest-workspace, multi-root-workspace, multiple-configs and no-config workspaces, which suggests these layouts are common enough to be worth dedicated examples.
Second, the extension is a frontend for a runner you already have. It does not replace the Vitest CLI in CI, it does not give you a reporter for a pipeline, and the cliArguments setting explicitly ignores watch, reporter, api and ui, so you cannot push reporter configuration through it.
Third, the feature set is editor-bound. Trace View applies to recorded Vitest 5 browser interactions, inline console display and the Testing view are editor features, and none of them exist in a headless run. If your question is why a suite is slow in CI, the import duration panel in continuous run mode in the editor is a starting point but not the answer.
The extension also assumes a Vitest project. It registers a TestController for Vitest, so a codebase testing with a different framework needs a different extension, and the two will coexist in the Testing view rather than one replacing the other.
Editorial conclusion
Adopt the Vitest extension if your team already runs Vitest and wants test execution, debugging and coverage inside the editor without leaving the Testing view, since it plugs into the standard VS Code test API rather than inventing its own panel. Do not expect it to solve config discovery in a messy monorepo, because it still resolves config files by glob search and the ignore patterns are known to miss layouts that need a manual rootConfig. Verify first that your Vitest version is at least v1.4.0 and your editor at least 1.77.0, that coverage needs editor version 1.88.0 or newer, and that a single folder or workspace file is in place so that vitest.rootConfig and vitest.workspaceConfig resolve to the paths you expect.
Frequently asked questions
What are the requirements for the Vitest VS Code extension?
Visual Studio Code 1.77.0 or newer, Vitest v1.4.0 or newer, and Node.js 18.0.0 or newer, which follows Vitest. Coverage needs Visual Studio Code 1.88.0 or newer, and the extension is published on the Visual Studio Marketplace as vitest.explorer.
How do I run a single Vitest test in VS Code?
Open a test file and click the test icon in the gutter next to the test case to run that one test. Right clicking the icon opens a context menu with Run Test, Debug Test, Run with coverage, Reveal in Test Explorer and Breakpoint Settings.
How do I configure the Vitest extension to find my config file?
Set vitest.rootConfig to the path of your root config file, or vitest.workspaceConfig for the workspace config, of which only one is allowed per VS Code workspace. If you have several Vitest configs, the documentation points to the Vitest workspace guide, and vitest.ignoreWorkspace disables the workspace resolution step entirely.
Can the Vitest extension run tests with Deno?
Yes. The vitest.runtime setting accepts auto, node and deno, with auto as the default, and in auto mode the extension looks for a deno.enabled config flag or a deno.json file in the root folder to decide.
Official sources
Add this badge to your README
If you maintain this project, the badge below links readers to this analysis and shows its maintenance status from the daily GitHub snapshot. Paste the markdown into your README; add ?metric=license or ?metric=stars to the image URL for a different field.

[](https://hysenlabs.com/projects/vitest-dev-vscode)Star history chart for your README
[](https://hysenlabs.com/projects/vitest-dev-vscode)Was this useful?