Heat.js: a zero dependency TypeScript heatmap with 60 languages and nine export formats
🌞 A highly customizable JavaScript library for generating interactive heatmaps. It transforms data into smooth, visually intuitive heat layers, making patterns and intensity easy to spot at a glance.
At a glance
- What is it?
- Heat.js is an MIT-licensed JavaScript library that turns dated activity data into interactive heat layers, in six view types from map to chart, with a global $heat API, 60 locales, CSS variable theming and import and export in nine formats. It binds to a DOM element through a data attribute, so no JavaScript wiring is needed to render the first chart.
- Who is it for?
- Heat.js suits a team that already has dated activity data, such as commits, logins, posts or visits, and wants an activity heatmap on a page without pulling in a charting framework, especially a TypeScript shop that wants typed bindings and per-element configuration. It does not suit a project whose data is not keyed by date, since the whole model is a calendar grid, and it does not suit a server-side rendering pipeline without checking how the DOM binding behaves.
- Can I use it commercially?
- Yes. MIT is a permissive licence: you can use, modify and sell software built on it, as long as you keep its copyright and licence notices.
- Is it still maintained?
- Yes. The repository last received commits 161 days ago.
- What is it written in?
- Mainly TypeScript, according to GitHub's language statistics.
Answers come from the project's GitHub data, last synced on November 7, 2026, and from our analysis. They are not legal advice.
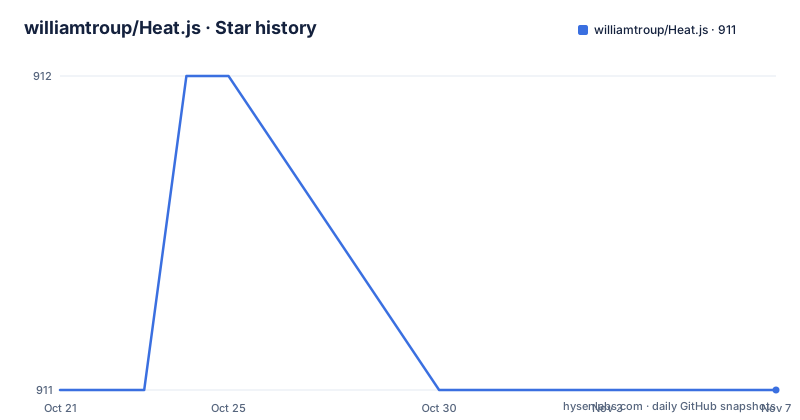
Star history
- williamtroup/Heat.js911 ★ · +0
| Repository | 2026-10-21 | 2026-11-07 |
|---|---|---|
| williamtroup/Heat.js | 911 | 911 |
0 Stars in the last 17 days, measured from the daily GitHub snapshot. Compare with other projects
Editorial analysis
Six views over one calendar grid, from a GitHub-style map to a chart
Heat.js is described as a highly customizable JavaScript library for generating interactive heatmaps, which transform data into smooth, visually intuitive heat layers so patterns and intensity are easy to spot at a glance. The structure of the library is a calendar grid, and the six views are different projections of it. There is the Map view, the Line view, the Chart view, the Days view, the Months view, and a Color Ranges view. The map is the familiar one, a year of activity laid out as a contribution graph, and the Days and Months views are its close relatives. The Chart and Line views came later, with v5.1.0 titled as Point/Line Chart Support, Improved y-axis labels and Improved Dynamic Colors. The year-wide statistics layer reports the total for day, week, month and year, which is the aggregation most activity pages want above the grid rather than buried inside it. The practical point is that the grid is the underlying model, and picking a view is picking how that grid is projected.
The DOM binding means the first chart needs no JavaScript at all
The installation and getting started flow is built around a data attribute rather than a JavaScript call. You include the stylesheet and the script, and then mark a div:
<div id="heat-map" data-heat-js="{ 'views': { 'map': { 'showDayNames': true } } }">
    Your HTML.
</div>
The library reads that attribute and configures itself from it, and the binding options and custom triggers are documented separately. That is the design decision worth understanding, because it has consequences in both directions. On the good side, a static page or a server-rendered template gets a heatmap with no client-side bootstrapping, and per-element configuration is fully declarative. On the other side, the configuration is a string inside an HTML attribute, which means it is parsed at runtime rather than type-checked, and the TypeScript advantage applies to the library's own API rather than to the attribute path. There is a full public API for everything the attribute can do, and a configuration dialog per view, so the attribute is an entry point rather than the only one.
Adding and removing a date at runtime, keyed by trend type
The library exposes a global object with a small, direct API for mutating the data. The README shows adding and removing dates, and the heat map updates automatically:
<script>
  let newDateObject = new Date();

  $heat.addDate( "heat-map", newDateObject, "Trend Type 1", true );
  $heat.removeDate( "heat-map", newDateObject, "Trend Type 1", true );
</script>
The trend type argument is the other half of the data model. Trend types allow data to be split up and viewed separately, so the same calendar grid can hold several independent series and the user can switch between them. There is a documented limitation attached to that feature: data pulling does not support trend types, so if you are pulling data from a server endpoint rather than binding it statically, the series separation does not apply. Auto spawning support is also listed, which covers the case where HTML is added by a third party library after the page has loaded, so the heatmap appears in a container that did not exist at page load.
Nine export formats and seven import formats, with an asymmetry worth knowing
Export supports nine formats: csv, json, xml, txt, html, md, tsv, yaml and toml. Import supports seven: csv, json, txt, md, tsv, yaml and toml. The difference is xml and html on the export side, and it is not a coincidence that html is export-only, since a rendered heatmap as a standalone document is a plausible thing to want while parsing HTML back in is not. The presence of toml and yaml in both directions is unusual for a charting library and suggests the author expects data to move between the chart and a range of configuration and data files rather than only into a spreadsheet. Exports are also something you can trigger from the configuration dialog, which is what turns the library from a display widget into something you can use to move data around.
Theming runs through CSS variables, with 31 themes in the box
The styling story is CSS and SASS, and the library is described as fully styled in CSS/SASS, fully responsive and compatible with the Bootstrap library. Theming uses :root variables, with dark and light themes, 31 available by default. Using CSS custom properties for this is what makes runtime colour changes cheap, since a theme switch is a change of variables rather than a re-render of the chart. There is also a separate colour ranges view, and colour ranges support different colours per view, so the same dataset can be read through different colour mappings in different projections. A toggling colours on and off feature is listed too, which is useful when you want the underlying grid without the heat layer. Sixty languages are shipped, with English as the default, and the locale list runs from Afrikaans through to Vietnamese and includes both Chinese (simplified) at zh and Taiwanese at zh-tw.
Zero dependencies and 100% TypeScript, with a tsup and SASS build
The two headline engineering claims are zero-dependencies and extremely lightweight, and 100% TypeScript allowing greater support for React, Angular and other libraries. The build configuration backs the TypeScript claim. The scripts run tsup through three separate config files, tsup.build.config.ts, tsup.build.esm.config.ts and tsup.build.min.config.ts, producing a CommonJS build, an ESM build and a minimized build, and the SASS source at src/heat.js.scss is compiled separately to dist/heat.js.css, with a compressed variant produced by the same tool with source maps disabled. The package manifest points main at dist/heat.js and types at dist/heat.d.ts, so the type declarations ship with the package. A separate nuspec file, heat.js.nuspec, and a README_NUGET.md show the library is also published to NuGet under the jHeat.js package name, alongside the npm package jheat.js, and there are shell scripts BUILD.sh, PACK.sh, PUBLISH.sh and SERVE.sh for the release and local serving workflow.
Where Heat.js is the wrong tool
The first limit is the data model itself. Everything is keyed by a date, and the grid is a calendar, so if your data is not naturally dated, such as a category breakdown or a distribution across arbitrary buckets, there is nothing for the library to draw and you are fighting the model rather than using it. The second is that the library is a front-end widget, not a service. It has no storage, no aggregation backend and no scheduling, so the data has to arrive in the page somehow, whether bound in the attribute, pulled from an endpoint or pushed in through the API. The third is that the configuration paths differ in what they support, since the data pulling feature does not support trend types, so a project that wants both a server-driven refresh and multiple series has to pick one. And with 31 shipped themes and 60 locales, the bundle is larger than the zero-dependency claim implies at first glance, so a page embedding six heatmaps for six teams should think about whether one shared instance would do.
MIT licensed, version 5.2.0, and moving fast enough to read the changelog
The licence is MIT, with a LICENSE.txt at the repository root, which is about as permissive as a front-end library can be and places no obligation on a commercial product that uses it. The project also ships a SECURITY.md and a CODE_OF_CONDUCT.md, and the README points to GitHub Discussions as the place for questions, which tells you where support happens. The release cadence is the thing to plan around. v5.2.0 came on 2026-05-30 with chart zooming support, more options and a TypeScript upgrade, v5.1.0 on 2026-03-26 added point and line chart support with improved y-axis labels and dynamic colours, and v5.0.1 on 2026-02-27 was a colour and export refresh. Three feature releases in three months, and the last push to the repository was on 2026-05-30. The repository carries a RECENT_CHANGES.md and the documentation site has its own recent changes page, so the changelog is something you are expected to read before upgrading rather than something you can skim.
Editorial conclusion
Heat.js suits a team that already has dated activity data, such as commits, logins, posts or visits, and wants an activity heatmap on a page without pulling in a charting framework, especially a TypeScript shop that wants typed bindings and per-element configuration. It does not suit a project whose data is not keyed by date, since the whole model is a calendar grid, and it does not suit a server-side rendering pipeline without checking how the DOM binding behaves. Before you adopt it, read the binding options and custom triggers pages rather than relying on the README, decide which view types you actually need since the configuration is per view, and confirm your data import format is one of the seven supported ones.
Frequently asked questions
How do I install Heat.js?
Install it from npm with npm install jheat.js, or download a zipped version from the download page on heatjs.com. CDN links are also published, pointing at dist/heat.min.js and dist/heat.js.min.css on jsDelivr for version 5.2.0.
How do I bind Heat.js to an element?
Include the stylesheet and script, then put a data-heat-js attribute on the container div. The README shows a div with id heat-map and a data-heat-js attribute holding a configuration object, and the library renders from that without any JavaScript call.
Which views and data formats does Heat.js support?
Six views are supported: Map, Line, Chart, Days, Months and Color Ranges. Export supports nine formats including csv, json, xml, txt, html, md, tsv, yaml and toml, while import supports seven of those, adding xml and html to the import list.
Does Heat.js work with React and Angular?
The project states it is 100% TypeScript, allowing greater support for React, Angular and other libraries, and ships type declarations at dist/heat.d.ts. The DOM binding attribute is one integration path, and a full public API of functions is available for programmatic use.
Official sources
Add this badge to your README
If you maintain this project, the badge below links readers to this analysis and shows its maintenance status from the daily GitHub snapshot. Paste the markdown into your README; add ?metric=license or ?metric=stars to the image URL for a different field.

[](https://hysenlabs.com/projects/williamtroup-heat-js)Star history chart for your README
[](https://hysenlabs.com/projects/williamtroup-heat-js)Was this useful?