Yabeda: one metrics API for a Ruby app, with the monitoring backend left open
Extendable framework for collecting and exporting metrics from your Ruby application
At a glance
- What is it?
- Yabeda is a Ruby framework for declaring, recording and exporting application metrics, built by Evil Martians, where the measurement code is written once and the destination is chosen with an adapter gem. It suits Rails and Sidekiq applications that want Prometheus, Datadog or StatsD output without rewriting instrumentation, and it stops at the point where you need per-process cache handling.
- Who is it for?
- Adopt Yabeda if you want one instrumentation layer in a Ruby application and the freedom to move between Prometheus, Datadog or a statsd-compatible backend later, and if your application runs on a single process model where the default client behaviour is fine.
- Can I use it commercially?
- Yes. MIT is a permissive licence: you can use, modify and sell software built on it, as long as you keep its copyright and licence notices.
- Is it still maintained?
- Yes. The repository last received commits 107 days ago.
- What is it written in?
- Mainly Ruby, according to GitHub's language statistics.
Answers come from the project's GitHub data, last synced on November 7, 2026, and from our analysis. They are not legal advice.
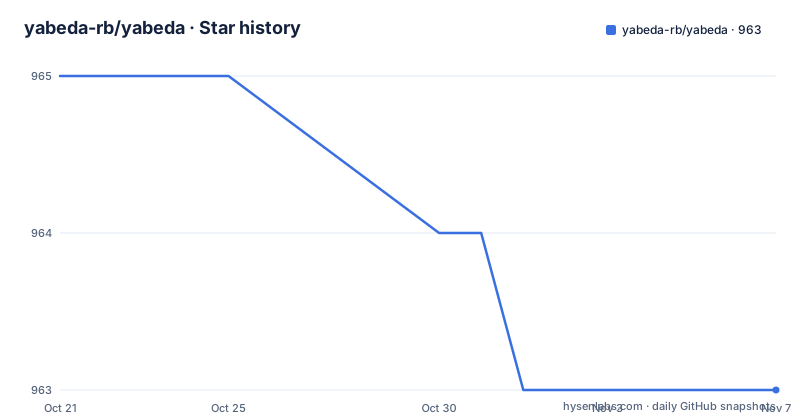
Star history
- yabeda-rb/yabeda963 ★ · -2
| Repository | 2026-10-21 | 2026-11-07 |
|---|---|---|
| yabeda-rb/yabeda | 965 | 963 |
-2 Stars in the last 17 days, measured from the daily GitHub snapshot. Compare with other projects
Editorial analysis
Instrument once, export to whichever backend you run
Metrics instrumentation in a Ruby application tends to arrive in one of two forms. Either the application calls a vendor library directly, in which case changing backends means touching every call site, or the application calls an abstraction and a separate adapter maps that abstraction onto the vendor, in which case the abstraction is usually written for one vendor and leaks its vocabulary.
Yabeda is the second kind, built with care about the boundary. The project is by Evil Martians, described in the README as an American design and engineering consultancy for developer tools, AI and cybersecurity startups, and the reasoning behind it is written up in their Martian Chronicles article, Meet Yabeda: Modular framework for instrumenting Ruby applications.
The audience is Ruby teams running web applications, typically on Rails, with a background of Sidekiq or Faktory jobs and a monitoring stack behind them. The primary language is Ruby, the gem is MIT licensed, and the design assumption is that the framework, the collectors and the backends are separate gems, so the dependency you add is the core plus a plugin plus an adapter, and nothing more until you need more.
Adding the gem, a plugin and an adapter
The installation section makes a point that surprises people. Most of the time you do not add yabeda to your Gemfile directly, unless you are only collecting your own custom metrics. The reason is that the collection plugins declare the dependency themselves, so a Rails application adds the Rails plugin and gets the framework with it.
A Gemfile that follows the documented layout looks like this:
gem 'yabeda'

# Add some plugins to quickly start collecting some essential metrics:
# gem 'yabeda-rails'
# gem 'yabeda-sidekiq'

# Then add monitoring system adapter, e.g.:
# gem 'yabeda-prometheus'
Three roles are visible there. The core gem provides the metric definitions and the recording API. The plugins supply instrumentation for a framework or a worker system, such as yabeda-rails for request metrics and yabeda-sidekiq for job execution and queue metrics. The adapter is what actually exports values, and the example given is yabeda-prometheus.
Once the Gemfile is right, the install is the ordinary Bundler step:
$ bundleNothing else is required at this point. The README's first numbered usage step is declaring your metrics, and that happens in your own code rather than in configuration, which is the point of the design.
Declare metrics in groups, then record values
Metrics are declared in a configure block, grouped by area of the application, and the declaration fixes the type, the tags and the documentation:
Yabeda.configure do
  group :your_app do
    counter   :bells_rang_count, comment: "Total number of bells being rang", tags: %i[bell_size]
    gauge     :whistles_active,  comment: "Number of whistles ready to whistle"
    histogram :whistle_runtime do
      comment "How long whistles are being active"
      unit :seconds
    end
    summary :bells_ringing_duration, unit: :seconds, comment: "How long bells are ringing"
  end
end
Four metric types are used here: a counter, a gauge, a histogram and a summary. The comment field is part of the declaration rather than a comment in the source, so it can be exported as metric documentation. Tags are declared as part of the metric definition, which is what lets the framework validate them later.
The second step is applying the configuration, and the README is explicit about the ordering: after your application was initialized and all metrics were declared, you need to apply Yabeda configuration:
Yabeda.configure!That split between declaring and applying is the mechanism that makes plugins possible. A plugin can add its own groups of metrics during the application boot, and the final configure! call is what actually turns the declared metrics into live collectors. If you are using Ruby on Rails then it is configured automatically, so in that case you do not call configure! yourself.
Recording a value goes through the group accessor, so the metric name is qualified by the group it belongs to. A counter is incremented with a tag set and an amount:
def ring_the_bell(id)
  bell = Bell.find(id)
  bell.ring!
  Yabeda.your_app.bells_rang_count.increment({bell_size: bell.size}, by: 1)
end
Timing is done with a measure block, which is the equivalent of a histogram or summary observation:
def whistle!
  Yabeda.your_app.whistle_runtime.measure do
    # Run your code
  end
end
The design keeps the metric name and the measurement call adjacent to the business logic that produces the value. The cost is that the metric name appears in the application code, so renaming a metric is a search and replace across the codebase rather than a configuration change. Note the shape of the tag argument: it is a hash passed positionally, so the tag keys are checked against the tags declared for that metric at declaration time.
Periodic collection through the collect block
Not every metric is tied to an event. Reporting the current state of the application, such as how many resources are currently active, is a different problem from counting something that just happened. Yabeda handles it with a collect block:
Yabeda.configure do
  # This block will be executed periodically few times in a minute
  # (by timer or external request depending on adapter you're using)
  # Keep it fast and simple!
  collect do
    your_app.whistles_active.set({}, Whistle.where(state: :active).count)
  end
end
The comment in the README says the block runs a few times a minute, and the mechanism depends on the adapter: some adapters pull on a timer inside the process, others expect an external request to scrape the endpoint. That distinction matters operationally, because a gauge that is only updated when somebody scrapes will show a stale value between scrapes.
The instruction to keep it fast and simple is a real constraint. The block runs inside the request path or the timer thread, so an expensive query inside it will slow the application or the scrape. The example uses a count of active records, which is the kind of operation that stays cheap.
Default tags, group tags and thread-local overrides
Tags can be set once for everything, once for a group, or for a single block of code. Default tags are declared in the same configure block:
Yabeda.configure do
  # matches all metrics in all groups
  default_tag :rails_environment, 'production'

  # matches all metrics in the :your_app group
  default_tag :tag_name, 'override', group: :your_app
end
For a limited amount of time, tags can be overridden with Yabeda.with_tags, which sets thread local tags:
Yabeda.with_tags(rails_environment: 'staging') do
  Yabeda.your_app.bells_rang_count.increment({bell_size: bell.size}, by: 1)
end
The precedence order is documented explicitly, from high to low: manually specified tags, then thread local tags specified by Yabeda.with_tags, then group specific tags, then global tags.
There is one rule that catches people out, and the README states it as a note: any usage of with_tags must have all those tags defined on all metrics that are generated in the block. In other words, if a block increments a metric that does not declare the tag you are overriding, the configuration fails rather than silently dropping the dimension. That strictness is deliberate, since a metric series whose tag set changes depending on the call site is the kind of thing that produces confusing dashboards later.
Adapters and plugins decide what you actually get
The value of the framework is the breadth of what surrounds it, so it is worth reading the two lists in the README closely.
The adapters maintained by the Yabeda team cover Prometheus, through yabeda-prometheus which wraps the official Ruby client for Prometheus, and yabeda-prometheus-mmap which wraps GitLab's fork of that client and, according to the README, may work better for multi-process application servers. There are also Datadog and NewRelic adapters. Third-party adapters cover Statsd, AWS CloudWatch, Honeybadger Insights and Sentry, and the README invites you to write your own and open a pull request to add it to the list.
The plugins maintained by the team collect metrics for Rails requests, ActiveRecord query performance and connection pool statistics, Sidekiq job execution and queues, Faktory workers, GraphQL-Ruby query and field-level monitoring, Puma internal state and performance, outgoing HTTP calls through Sniffer, Schked cron jobs, and AnyCable RPC calls. Third-party plugins cover Grape, the gRPC Ruby framework gruf, garbage collection, ActiveJob, Shoryuken, Rack ratelimiting and Hanami.
The mmap adapter is the clearest example of why the adapter boundary exists. A multi-process application server does not share memory between workers, so a metric held in a process-local cache is invisible to other workers, and the forked Prometheus client exists to deal with that. A framework that hid this choice would hide a production problem.
Where Yabeda is not the right answer
There are limits that follow from the design rather than from missing features.
The measurement API lives in your application code. Metric names appear next to the logic that produces them, so a metric that several teams report on has to be renamed in every place, and the framework does not provide a central registry file for metric names outside the group and name you wrote in the declaration.
Second, the adapter layer is not optional in practice. Even though the framework is vendor-neutral, the multi-process caveat above means the choice of adapter changes whether your numbers are correct on a given server. Third, the plugin ecosystem is broad but each plugin is a separate gem with its own version and its own release pace, so a Rails application ends up with a handful of dependencies whose maintenance you do not control.
Fourth, the version line is still 0.x. The recent releases are v0.14.0 from 2025-09-10, v0.15.0 from 2026-03-04 with concurrency fixes, and v0.16.0 from 2026-03-12 which adds limiting and excluding metrics from groups. Those are useful, small releases, but a 0.x version carries no compatibility promise, so pinning is worth doing. The last push was on 2026-07-24, and the project publishes a CHANGELOG.md and a gem specification in the repository, so the release notes are the place to look for behaviour changes.
Against calling your monitoring vendor directly
The alternative is to skip the framework and use the vendor's own client. If you are certain you will run Prometheus for the life of the application, calling the official Prometheus Ruby client from your code is fewer moving parts, one dependency instead of three, and no configuration step to forget.
The difference in approach is about where the decision lives. A direct vendor client binds your instrumentation to that vendor's API: the metric object, the label set and the export path are all theirs, and moving to a different backend later means rewriting the call sites. Yabeda puts a thin, stable-shaped interface in front, where the metric declaration, the group, the tag set and the recording call are all yours, and the adapter gem translates that into the vendor's vocabulary.
The cost of the abstraction is real but bounded. You add the core gem, at least one plugin and one adapter, you have a configure step to remember, and you accept that some vendor features will not map onto the abstraction, since the framework's four metric types and tag model are a deliberate narrowing.
There is a third option worth naming, the plugin without the framework: a thin module of your own that wraps the vendor client and is called from a few places. That is a reasonable middle ground for a small application. It becomes painful when the same concept has to be reported from a Rails controller, a Sidekiq worker, an ActiveRecord callback and a Puma monitor, because then you are writing the plugin ecosystem yourself.
Editorial conclusion
Adopt Yabeda if you want one instrumentation layer in a Ruby application and the freedom to move between Prometheus, Datadog or a statsd-compatible backend later, and if your application runs on a single process model where the default client behaviour is fine. Do not adopt it if you need a multi-process server setup without reading the adapter notes, since the mmap Prometheus adapter exists precisely because the default client behaves differently there, and do not expect a stable API surface while the gem is still on a 0.x version line. Verify first that the adapter you want exists, that Yabeda.configure! is called after your metrics are declared, and that every tag you pass to Yabeda.with_tags exists on the metrics used inside that block. The licence is MIT and the last push was on 2026-07-24.
Frequently asked questions
How do I install Yabeda in a Ruby application?
Add the gems to your Gemfile, usually the core yabeda gem plus a plugin such as yabeda-rails or yabeda-sidekiq and an adapter such as yabeda-prometheus, then run bundle. The README notes you usually do not need to add yabeda to the Gemfile directly unless you only collect your own custom metrics, since plugins pull it in.
When should Yabeda.configure! be called?
After the application has initialized and all metrics have been declared, so that plugins can contribute their own groups before the configuration is applied. If you are using Ruby on Rails the configuration is applied automatically, so you do not call configure! yourself.
Which metric types does Yabeda support?
The declaration syntax in the README uses counter, gauge, histogram and summary, with comment and unit metadata and a declared list of tags. Metrics are grouped, for example inside a group :your_app block, and reached through the group accessor such as Yabeda.your_app.bells_rang_count.
How do I report a value that is not tied to an event?
Use the collect block, which the README says runs a few times a minute, either on a timer or on an external request depending on the adapter. Inside it you set gauges directly, for example your_app.whistles_active.set({}, Whistle.where(state: :active).count), and the documentation warns to keep the block fast.
How do tag precedence rules work in Yabeda?
From high to low the precedence is manually specified tags, thread local tags set with Yabeda.with_tags, group specific tags, then global tags. The README also notes that every tag passed to with_tags must be defined on all metrics generated inside that block.
Which monitoring backends can Yabeda export to?
Team maintained adapters cover Prometheus, including an mmap variant wrapping GitLab's fork for multi-process servers, plus Datadog and NewRelic, while third-party adapters cover Statsd, AWS CloudWatch, Honeybadger Insights and Sentry. The README invites you to write your own adapter and open a pull request.
Official sources
Add this badge to your README
If you maintain this project, the badge below links readers to this analysis and shows its maintenance status from the daily GitHub snapshot. Paste the markdown into your README; add ?metric=license or ?metric=stars to the image URL for a different field.

[](https://hysenlabs.com/projects/yabeda-rb-yabeda)Star history chart for your README
[](https://hysenlabs.com/projects/yabeda-rb-yabeda)Was this useful?