ServerStatus-Rust reports over gRPC or HTTP, marks hosts offline after 30 seconds, and has not tagged a release since March 2024
Rust version of the ServerStatus probe - a power-enhanced edition.
At a glance
- What is it?
- A Rust rewrite of the ServerStatus probe: one server binary, one client binary, a status page, and alerts. This review covers the install script, the config.toml defaults, the Docker setup, the client platforms and the gap between its last release and its last commit.
- Who is it for?
- Use ServerStatus-Rust to watch a handful of your own VPS or home machines from one status page, with alerts to Telegram, WeChat, email or a webhook. Do not use it for the Rust game servers that share its name in search results, and do not expect a recent tagged build: the newest release is v1.8.1 from 2024-03-18.
- Can I use it commercially?
- Yes. Apache-2.0 is a permissive licence: you can use, modify and sell software built on it, as long as you keep its copyright and licence notices.
- Is it still maintained?
- Yes. The repository last received commits 11 days ago.
- What is it written in?
- Mainly Rust, according to GitHub's language statistics.
Answers come from the project's GitHub data, last synced on November 6, 2026, and from our analysis. They are not legal advice.
Star history
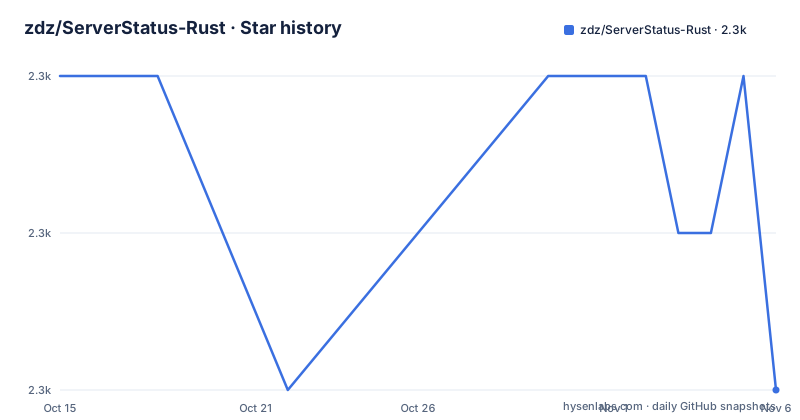
- zdz/ServerStatus-Rust2,333 ★ · -2
| Repository | 2026-10-15 | 2026-11-06 |
|---|---|---|
| zdz/ServerStatus-Rust | 2.3k | 2.3k |
-2 Stars in the last 22 days, measured from the daily GitHub snapshot. Compare with other projects
Editorial analysis
One server binary and one client binary replace the original ServerStatus scripts
ServerStatus-Rust is a rewrite of the ServerStatus probe in Rust, kept lightweight and simple to deploy. Both server and client are fully rewritten, and each deploys as a single executable. The Cargo workspace has three members: common, server and client. The server binary is stat_server and the client is stat_client.
The release profile in Cargo.toml is tuned for size: opt-level is set to "z", lto is on, codegen-units is 1 and panic is set to abort. A size-optimised binary with no unwinding is a sensible fit for a probe that runs on small VPS machines and Raspberry Pis.
The project lists Linux, macOS, Windows, Android and Raspberry Pi as supported systems. The client downloads are named by target triple, for example x86_64-unknown-linux-musl for Linux x86_64 and aarch64-unknown-linux-musl for Linux arm64. Windows uses x86_64-pc-windows-msvc, Raspberry Pi uses armv7-unknown-linux-musleabihf, and Android ships both aarch64-linux-android and armv7-linux-androideabi.
A plain description of the trade: you get a small, static footprint on each monitored host, and you give up the language-level familiarity of the original scripts.
The one-touch script pulls a shell script from master and disables certificate checks
The quick trial installs under /opt/ServerStatus and runs a script downloaded from the master branch:
mkdir -p /opt/ServerStatus && cd /opt/ServerStatus
wget --no-check-certificate -qO one-touch.sh 'https://raw.githubusercontent.com/zdz/ServerStatus-Rust/master/scripts/one-touch.sh'
bash -ex one-touch.sh
Afterwards you open http://127.0.0.1:8080/ or http://<your IP>:8080/. The script is described for CentOS, Debian and Ubuntu on x86_64, and the install notes say to run apt install -y unzip or yum install -y unzip first.
Two things in that block deserve a read before you run it as root. The wget call uses --no-check-certificate, so it skips TLS verification when fetching the script. And it executes whatever sits on master at that moment. Reading scripts/one-touch.sh before running it takes a minute and tells you exactly what lands on the machine, including the systemd unit.
The separate status.sh management script, contributed by Colsro and Yooona-Lim, installs the server with bash status.sh -i -s and a client with bash status.sh -i -c. It also accepts a connection URL such as grpc://h1:[email protected]:9394 or http://h1:[email protected]:8080, and has an upgrade flag, -up.
config.toml defaults: two listeners, a 30 second offline timer and random admin credentials
The server reads config.toml. It listens for gRPC on 0.0.0.0:9394 and HTTP on 0.0.0.0:8080, and the comment notes that IPv6 uses [::]:9394. A host is judged offline when it has not reported for offline_threshold seconds, which defaults to 30.
admin_user and admin_pass are empty by default. When unset, the project generates a random account. That account is used to view the /detail and /map pages. Anyone running a public instance should set both fields deliberately, because a random login you never saw is a login you cannot use.
Hosts are declared in one of two modes, hosts or hosts_group, and you pick one. Each host needs a unique name, with alias as the display name. Per-host options include notify = false to silence alerts for a machine that flaps on a poor network, monthstart to set which day the monthly traffic count begins when vnstat is off, and disabled = true to switch one host off. Location accepts a flag emoji or a country code such as cn or us, and labels carry values like os, ndd for the next due date and spec for the machine size.
The flag assets live under web/static/flags. Validate a config before restarting with ./stat_server -c config.toml -t, and test alert delivery with ./stat_server -c config.toml --notify-test.
HTTP reporting exists so the server can sit behind a free container host or Cloudflare
Clients can report over gRPC or over HTTP. The HTTP path is there to make deployment to free container services easier, and to work with Cloudflare for optimising the reporting route. The project also lists support for Cloudflare Tunnels and mTLS deployment.
A client points at the report endpoint of the server:
./stat_client -a "http://127.0.0.1:8080/report" -u h1 -p p1For the public internet, the client notes advise networking through headscale or nebula, or going over HTTPS with nginx in front of the server and a custom location for /report. The consequence is plain. The default plain HTTP link carries the username and password you chose, so exposing port 8080 or 9394 directly to the internet leaves them unprotected.
On Alpine Linux, the client needs procps, iproute2 and coreutils, installed with apk add. If the Rust client does not work on your system at all, there is a Python cross-platform client as the fallback.
Railway and Heroku deployments are documented in the wiki and in heroku/README.md. The Railway page is aimed at people who do not want to configure Nginx and SSL certificates themselves.
The Docker image runs from scratch with a config file and a stats.json bind-mounted in
The Dockerfile builds in rust:1.76-alpine3.19, installs musl-dev, git, cmake, make and g++, runs cargo build --release --bin stat_server, strips the binary, and copies it with config.toml into a scratch image. The final image exposes ports 8080 and 9394 and starts /stat_server -c /config.toml.
The docker-compose.yml uses the image idoge/stat_server:latest, a container named stat_server and the restart policy unless-stopped. It mounts /etc/localtime read-only, plus ./config.toml and ./stats.json, and publishes 8080 and 9394.
The setup steps create stats.json with touch before first start. Skip that and Docker creates a directory at that path, which breaks the file mount. Persisting stats.json also matters for the traffic figures: it is the file the server writes its state to.
The latest tag is a moving target. The compose file does not pin a version, so a pull can move you to a newer image than the one you tested. Pin a tag if a surprise upgrade would hurt.
Monthly traffic survives a restart only if vnstat is enabled
The project supports vnstat for counting monthly traffic, and says traffic data is not lost on restart when it is on. When vnstat is not enabled, the monthstart value in config.toml sets which day of the month the count begins.
That is the difference to weigh. Without vnstat, the server holds the running totals itself, and your monthly figure depends on the server and stats.json staying intact. With vnstat, the number comes from a tool that already tracks the interface on the host, so a server redeploy does not reset it. The README has a dedicated section on enabling vnstat support, which is the place to follow the exact steps.
Alerts cover online and offline transitions plus simple custom rules, delivered through Telegram, WeChat, email or webhook. Hosts with a bad route can set notify = false so they do not page you every few minutes.
The last tag is v1.8.1 from March 2024, while commits continue into October 2026
The repository is not archived. The last push was on 2026-10-20. The recent releases are v1.8.1 on 2024-03-18, v1.8.0 on 2024-02-16 and v1.7.2 on 2023-05-28. No tagged build has appeared for roughly nineteen months, so recent commits reach you only if you build from source or use the latest Docker image.
Full documentation moved to doc.ssr.rs, and the README keeps only an overview. A live demo runs at ssr.rs. Community themes are listed, including ServerStatus-theme by JingBh, ServerStatus-Theme-Light by orilights, Hotaru by HinataKato, ServerStatus-web by mjjrock and a nezha-style theme by snowie2000. The frontend can be deployed separately, with the steps in discussion 37.
The name causes confusion in search. Queries about Rust console servers, game server status and server IPs refer to the video game. This project monitors your own machines and has nothing to do with game servers.
Editorial conclusion
Use ServerStatus-Rust to watch a handful of your own VPS or home machines from one status page, with alerts to Telegram, WeChat, email or a webhook. Do not use it for the Rust game servers that share its name in search results, and do not expect a recent tagged build: the newest release is v1.8.1 from 2024-03-18. Before deploying, decide how clients reach the server, since the project advises HTTPS or a private overlay network for public links, and replace the empty admin credentials in config.toml.
Frequently asked questions
Are servers down on Rust right now?
ServerStatus-Rust does not report on the Rust video game. It is a probe written in the Rust language for monitoring your own servers, and it marks a host offline after 30 seconds without a report by default.
Where to find rust server IP?
This project holds no game server addresses. Its server listens on 0.0.0.0:8080 for HTTP and 0.0.0.0:9394 for gRPC, and you open http://<your IP>:8080/ to see the status page of your own deployment.
How do I update my Rust server?
For a ServerStatus-Rust deployment, status.sh has an upgrade flag, -up, and the project's Docker route uses the image idoge/stat_server:latest, which you can pull again. Game server updates are outside this project.
Official sources
Add this badge to your README
If you maintain this project, the badge below links readers to this analysis and shows its maintenance status from the daily GitHub snapshot. Paste the markdown into your README; add ?metric=license or ?metric=stars to the image URL for a different field.

[](https://hysenlabs.com/projects/zdz-serverstatus-rust)Star history chart for your README
[](https://hysenlabs.com/projects/zdz-serverstatus-rust)Was this useful?