AntV G6: a TypeScript graph visualization engine for relational data
♾ A Graph Visualization Framework in JavaScript.
At a glance
- What is it?
- G6 renders networks, trees and combos in Canvas, SVG or WebGL, with force layouts and drag behaviors configured in one object. It fits product teams that need to draw a graph, not a chart library that happens to know about edges.
- Who is it for?
- Adopt G6 if your data is genuinely relational and you need layouts, interactions and theming wired together rather than assembled from primitives; it is the wrong choice for simple bar or line charts, where a charting library is less machinery.
- Can I use it commercially?
- Yes. MIT is a permissive licence: you can use, modify and sell software built on it, as long as you keep its copyright and licence notices.
- Is it still maintained?
- Yes. The repository last received commits 1 day ago.
- What is it written in?
- Mainly TypeScript, according to GitHub's language statistics.
Answers come from the project's GitHub data, last synced on November 14, 2026, and from our analysis. They are not legal advice.
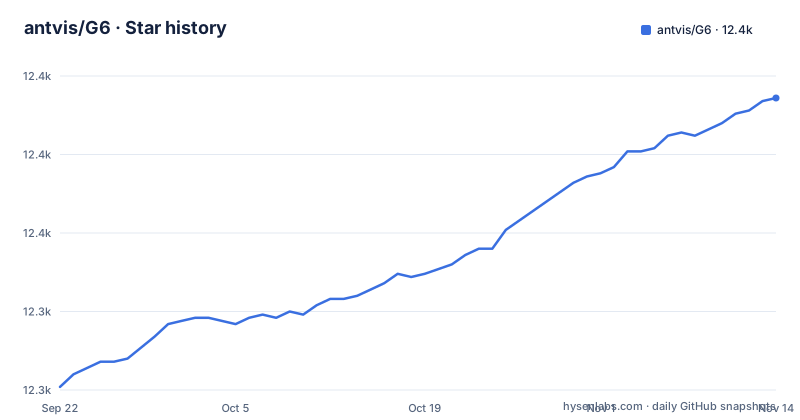
Star history
- antvis/G612,393 ★ · +92
| Repository | 2026-09-22 | 2026-11-14 |
|---|---|---|
| antvis/G6 | 12.3k | 12.4k |
92 Stars in the last 53 days, measured from the daily GitHub snapshot. Compare with other projects
Editorial analysis
What G6 is for, and who ends up using it
G6 describes itself as a graph visualization engine, and the description is narrow on purpose. It draws nodes, edges and combos, runs layouts over them, and exposes interaction, animation, themes and plugins around that. The README lists the capabilities as drawing, layout, analysis, interaction, animation, themes and plugins, with the stated goal that users can build graph visualization and analysis applications and make relational data simple, transparent and meaningful.
The audience follows from that. For entities and relationships, a graph-focused engine offers layouts and interactions suited to connected data. Some general chart libraries also support graph series, so compare their capabilities with the complexity of your use case. G6 targets product teams building topology views, dependency maps, knowledge graphs, org or flow structures, and the kind of internal tool where an operator needs to drag a node, hover a neighbor, and see the graph rearrange. The repository is TypeScript, the package is published as @antv/g6, and the licence is MIT, so it drops into a normal front-end build rather than a bespoke rendering stack.
The trade-off is that G6 is a framework, not a component. You configure a Graph instance and it owns the canvas, the data model, the render loop and the event wiring. That is convenient until you want to render something that is not a graph inside the same surface.
How a G6 graph is configured and rendered
The mechanism visible in the README is a single configuration object passed to the Graph constructor. You supply a container, the data as nodes and edges, per-element options such as node styling, a layout, and a list of behaviors. G6 then resolves that configuration into a rendered scene.
Several parts of that pipeline are worth separating. Elements come from built-in node, edge and Combo types with style configuration, and the README states there is a mechanism for extending custom elements and that data callbacks are supported. Layouts are a separate concern: the README claims more than 10 common graph layouts, notes that some use GPU and Rust parallel computing, and says custom layout development is supported. Behaviors are the third layer, with more than 10 built-in interaction behaviors and an event system for custom ones.
Rendering is delegated to AntV's G library, which is why the README can claim Canvas, SVG and WebGL output plus server-side rendering with Node.js, along with plugin packages for WebGL-based 3D rendering and spatial interaction. There is also a React path: the README says G6 supports React nodes, which matters because it means node content can be written as React rather than as G6 shape primitives.
The layering is the design decision to judge. Data, layout, behavior and renderer are independent, so swapping a force layout for a tree layout does not force you to rewrite interactions.
Installing @antv/g6 and rendering a first graph
The README installs G6 through a package manager such as npm or Yarn. The npm form is a single package:
npm install @antv/g6You then need a DOM element for the graph to occupy. The README uses a div with an id:
<div id="container"></div>From there, import Graph, build a data object with nodes and edges arrays, and create the instance. The README's example configures a node palette grouped by a cluster field, a force layout, and two behaviors:
import { Graph } from '@antv/g6';

const data = {
  nodes: [
    /* your nodes data */
  ],
  edges: [
    /* your edges data */
  ],
};

const graph = new Graph({
  container: 'container',
  data,
  node: {
    palette: {
      type: 'group',
      field: 'cluster',
    },
  },
  layout: {
    type: 'force',
  },
  behaviors: ['drag-canvas', 'drag-node'],
});

graph.render();
Calling graph.render() is what starts the pipeline; the README shows the resulting graph as an image below the snippet. The two behaviors named in the array are drag-canvas and drag-node, which give panning and node repositioning without additional code. If the container id does not match, or the nodes array is empty, there is nothing to look at, and the README does not describe error output for either case.
Where G6 gets in the way
The most concrete limitation is the one the README states as a feature: G6 is a full engine with its own container, renderer and event system. If you only need to show a small fixed tree, that is a lot of surface area to adopt..
Version churn is the second issue. The repository's recent releases show 5.1.1 on 2026-04-17, preceded by 5.0.49 on 2025-06-26 and 5.0.48 on 2025-05-24. The default branch is v5, and the publish script targets the v5 branch, so v5 is where development happens. The official documentation provides a v4-to-v5 upgrade guide. Review its breaking changes and test your own customizations before upgrading.
Performance claims need the same care. The README says some layouts use GPU and Rust parallel computing, but it does not say which ones, and it gives no numbers. Layout cost on a large graph is the thing most likely to hurt, and it is the thing you cannot size from the README alone. Finally, the README does not document rollback or downgrade procedures, which matters if you ship a graph into a production dashboard and a layout behaves differently after an upgrade.
Graphin and Ant Design Charts in the same ecosystem
The README names two ecosystem projects, and they differ from G6 in approach rather than in capability. Ant Design Charts is described as a React chart library based on G2, G6, X6 and L7. Graphin is described as a simple React wrapper based on G6, plus an SDK for developing graph visualization applications.
That distinction is the one to act on. G6 is imperative: you construct a Graph, hand it a container, and call render. Graphin wraps that in React, which suits an application whose state already lives in components and whose graph needs to react to props. Ant Design Charts goes further and puts G6 behind a chart-shaped API, which is the right level of abstraction if your page mixes graphs with ordinary charts and you want one library for both.
Choosing G6 directly is reasonable when you need control over behaviors, custom elements or renderer selection, because the wrapper has to expose those somehow and the README does not describe how far either wrapper goes. If your requirement is a React graph component with conventional props, starting at G6 means rebuilding what Graphin already offers.
Maintenance, upgrades and the MIT licence
The last push to the repository was on 2026-10-27, and the repository is not archived. That is recent enough that the project is not dormant, but the release cadence is uneven: 5.1.1 landed on 2026-04-17, while the two releases before it were 5.0.49 on 2025-06-26 and 5.0.48 on 2025-05-24. Plan upgrades around that gap rather than assuming continuous small releases.
The repository is a pnpm and turbo monorepo: the root package.json is private, the build script runs turbo build filtered to exclude @antv/g6-site, and publishing is done with pnpm publish -r on the v5 branch. Versioning is handled through changesets and a scripts/version.sh script. If you contribute, that is the machinery you will meet: commitlint with conventional commits, husky hooks, eslint and prettier on staged files, and Playwright for browser tests.
G6 is MIT licensed, which in practice means you can use it in commercial and closed-source products provided you keep the licence notice. That is a statement about the licence text, not legal advice; if your organisation has rules about third-party dependencies, check the actual LICENSE file and your own policy.
Editorial conclusion
Adopt G6 if your data is genuinely relational and you need layouts, interactions and theming wired together rather than assembled from primitives; it is the wrong choice for simple bar or line charts, where a charting library is less machinery. Before committing, verify the current v5 API against the version you install, confirm which layouts in the documentation use GPU or Rust acceleration, and check whether your target browsers are covered by the Canvas, SVG and WebGL renderers you plan to use.
Frequently asked questions
How do I install AntV G6?
The README installs it through a package manager such as npm or Yarn, with npm install @antv/g6. You then import Graph from @antv/g6 and create an instance pointing at a container element.
Can I use AntV G6 in a React application?
Yes. The README states that G6 supports React nodes through the React front-end ecosystem, which lets node content be written as React. The README also names Graphin, a simple React wrapper based on G6, and Ant Design Charts, a React chart library built on G2, G6, X6 and L7.
Which rendering backends does AntV G6 support?
According to the README, G6 renders through AntV's G library and supports Canvas, SVG and WebGL, plus server-side rendering with Node.js. It also offers plugin packages for WebGL-based 3D rendering and spatial interactions.
Is AntV G6 the same as AntV G6 v4?
No. Version 5 is a new major line with API and behaviour changes. The official G6 documentation provides an upgrade guide from 4.x to 5.x; test your layouts, custom elements and interactions against the version you choose.
Official sources
Add this badge to your README
If you maintain this project, the badge below links readers to this analysis and shows its maintenance status from the daily GitHub snapshot. Paste the markdown into your README; add ?metric=license or ?metric=stars to the image URL for a different field.

[](https://hysenlabs.com/projects/antvis-g6)Star history chart for your README
[](https://hysenlabs.com/projects/antvis-g6)Was this useful?