VivaGraphJS: a JavaScript graph drawing library with swappable renderers and layouts
Graph drawing library for JavaScript
At a glance
- What is it?
- VivaGraphJS splits graph storage, physics and rendering into separate ngraph modules, so you can render the same graph with SVG or WebGL and tune the force layout yourself. The trade-off is that tuning is manual and the project ships no releases.
- Who is it for?
- Adopt VivaGraphJS if you want direct control over the force simulation and you are willing to tune springLength, springCoeff, dragCoeff and gravity by hand, or if you need to switch between SVG and WebGL rendering for the same graph. Do not adopt it if you need a maintained release channel, TypeScript types or a layout that just works at default settings: the README itself calls tuning the hardest part of using the library.
- Can I use it commercially?
- Check first. The repository uses a licence we do not classify automatically, so read its LICENSE file before any commercial use.
- Is it still maintained?
- Activity is slowing. The repository last received commits 8 months ago.
- What is it written in?
- Mainly JavaScript, according to GitHub's language statistics.
Answers come from the project's GitHub data, last synced on November 14, 2026, and from our analysis. They are not legal advice.
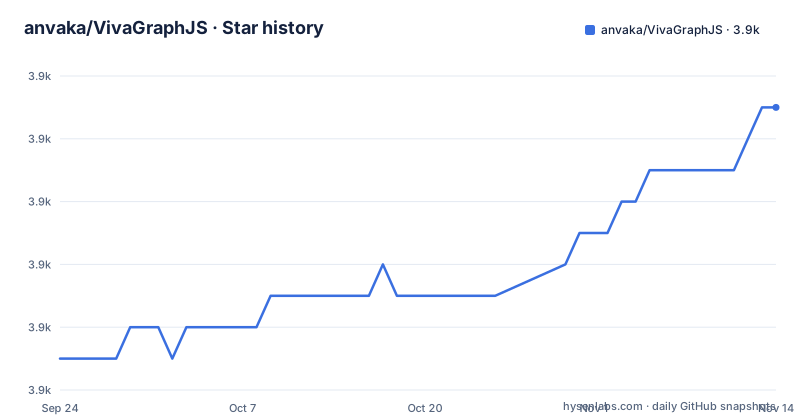
Star history
- anvaka/VivaGraphJS3,869 ★ · +8
| Repository | 2026-09-24 | 2026-11-14 |
|---|---|---|
| anvaka/VivaGraphJS | 3.9k | 3.9k |
8 Stars in the last 51 days, measured from the daily GitHub snapshot. Compare with other projects
Editorial analysis
The problem VivaGraphJS solves, and who actually needs it
Most JavaScript graph libraries bundle one drawing approach and one layout algorithm. VivaGraphJS takes the opposite position: the README states it is "designed to be extensible and to support different rendering engines and layout algorithms", and the underlying algorithms have been broken out into the ngraph family of modules. That split matters when a graph has to be drawn twice, once as crisp SVG for a small diagram and once through WebGL for a dense one, without rewriting the data layer in between.
The audience is narrow but real. It fits engineers who already think in terms of nodes, links and a physics simulation, and who want to call layout.simulator.springLength(newValue) while the graph is running. It does not fit someone who wants a declarative component that renders a network chart from a data prop. The README points at three production examples that lean on exactly this split: an Amazon related-products visualization using SVG output, a viewer for the University of Florida sparse matrix collection, and a friendship visualization of vk.com, the last two WebGL based.
How the graph, the renderer and the physics simulator fit together
There are three objects in the minimum example: a graph, a renderer and, implicitly, a layout. Viva.Graph.graph() holds nodes and links. Viva.Graph.View.renderer(graph) orchestrates drawing and drives the simulation. The graphics class, either Viva.Graph.View.svgGraphics() or Viva.Graph.View.webglGraphics(), decides how each node and link is painted.
Data flows one way. You mutate the graph with addNode and addLink, the renderer asks the layout where each node should sit, and the graphics layer converts those positions into DOM or GL primitives. The README notes that addLink(1, 2) on an empty graph creates nodes 1 and 2 implicitly, which is convenient and also means a typo in a node id silently adds a node rather than failing.
The customization hooks are functions, not configuration objects. graphics.node(function(node) { ... }) is called every time the renderer needs a UI element for a node, and node.data carries whatever object you passed to addNode. placeNode then positions that element, and the README's avatar example shifts the image by 12 pixels on each axis so links terminate at the center rather than the corner. Layout is a separate constructor, Viva.Graph.Layout.forceDirected(graph, options), passed into the renderer as the layout key.
Installing VivaGraphJS and drawing your first graph
The package is published as vivagraphjs, version 0.12.0, with src/viva as its main entry. The README's own instruction is to include vivagraph.js from the dist folder, which suits a plain script tag in a browser. If you are working from npm, the package name is the one to install:
npm install vivagraphjsThe smallest working graph needs three lines. This creates a graph, adds a link between nodes 1 and 2, and runs the default renderer, which the README says instantiates the graph inside document.body:
var graph = Viva.Graph.graph();
graph.addLink(1, 2);

var renderer = Viva.Graph.View.renderer(graph);
renderer.run();
To keep the drawing out of the page body, pass a container. The README uses a div with the id graphDiv, and the renderer then draws into that element instead:
var renderer = Viva.Graph.View.renderer(graph, {
  container: document.getElementById('graphDiv')
});
renderer.run();
Switching that same graph to WebGL means constructing webglGraphics and passing it as the graphics option. Nothing about the graph data changes:
var graphics = Viva.Graph.View.webglGraphics();

var renderer = Viva.Graph.View.renderer(graph, {
  graphics: graphics
});
renderer.run();
For a first real use, the README generates a 3x3 grid and then tunes the physics, because the default parameters produce what it calls a pretty ugly result. The four keys it sets are springLength, springCoeff, dragCoeff and gravity:
var graphGenerator = Viva.Graph.generator();
var graph = graphGenerator.grid(3, 3);

var layout = Viva.Graph.Layout.forceDirected(graph, {
  springLength: 10,
  springCoeff: 0.0005,
  dragCoeff: 0.02,
  gravity: -1.2
});

var renderer = Viva.Graph.View.renderer(graph, { layout: layout });
renderer.run();
After renderer.run() the graph animates as the simulation settles. The full list of tunable values lives in the ngraph.physics.simulator source file that the README links to, not in the README itself.
Where VivaGraphJS gets in your way
The README is unusually candid: "Tuning layout algorithm is definitely one of the hardest part of using this library. It has to be improved in future to simplify usage." That is a limitation stated by the project, not an outside criticism. The default forceDirected parameters are not good for every graph shape, and the documentation offers one worked example, a 3x3 grid, as the guide for choosing four numeric coefficients. A graph with a few hundred nodes and few edges and a graph that connects every node to every other need different values, and the README says so without giving a procedure for finding them.
The release situation is the second constraint. The repository has no published GitHub releases, while package.json declares version 0.12.0. If you depend on tagged artifacts, there is nothing to pin against here; the dist folder and the source tree are what exist. The dependency list is also pinned to old, small ngraph modules, including ngraph.forcelayout 0.5.0 and ngraph.graph 0.0.14, so the physics behaviour you get is the behaviour of those specific versions.
Finally, the API is imperative and global. You call Viva.Graph.graph() and renderer.run() yourself, and the README's examples assume a Viva global is present. There is no documented rollback or teardown path in the README, and no TypeScript definitions are mentioned anywhere in the repository files. If your application is built around declarative components that mount and unmount, you are writing the lifecycle glue.
How VivaGraphJS differs from Cytoscape.js and D3
The comparison people actually search for is Cytoscape.js versus D3, and VivaGraphJS sits on a different axis from both. Cytoscape.js is a graph analysis and visualization library with its own style model and a large built-in algorithm set; you describe the graph and its styles, and the library owns the rendering. D3 gives you scales, selections and force simulations as primitives you assemble yourself, with no graph object at all.
VivaGraphJS is closer to D3 in spirit but ships more of the pipeline. It provides the graph container, a force-directed layout and two renderers, and it lets you replace the renderer or the layout independently. The distinctive part is the WebGL path: the README's own examples of large graphs, the sparse matrix viewer and the vk.com friendship visualization, are WebGL based, and switching between SVG and WebGL is a one-line change of the graphics option. That is a narrower promise than Cytoscape.js makes and a more assembled one than D3 makes. If you want a styling language and layout extensions, look at Cytoscape.js. If you want to build the whole thing from primitives, D3 is the lower-level choice.
Maintenance, licensing and what upgrading costs
The repository is not archived, and the last push was on 2026-03-06. The repository has no published GitHub releases, so version bumps are not something you can plan around from tags. Upgrading means tracking the master branch, the src tree and the dist build, and re-checking that the pinned ngraph modules still behave as your layout tuning expects.
The licence field in the repository metadata is NOASSERTION, which means the automated classifier could not identify a standard licence from the repository. The package.json, however, declares "license": "BSD-3-Clause", and a LICENSE file sits at the top level of the repository. Those two signals disagree, and that disagreement is worth resolving by reading the LICENSE file before you depend on the project. This is not legal advice; it is a note that the two places you would normally check do not say the same thing.
The build is gulp-based. package.json defines start as gulp, build and release as gulp release, and test as tap test/*.js, with browserify, gulp-uglify and tap among the devDependencies. Running your own build rather than consuming dist is therefore supported, but it means carrying that toolchain.
Editorial conclusion
Adopt VivaGraphJS if you want direct control over the force simulation and you are willing to tune springLength, springCoeff, dragCoeff and gravity by hand, or if you need to switch between SVG and WebGL rendering for the same graph. Do not adopt it if you need a maintained release channel, TypeScript types or a layout that just works at default settings: the README itself calls tuning the hardest part of using the library. Before committing, verify that src/viva resolves as the package main entry, that the dist/vivagraph.js build matches the version you expect, and that the pinned ngraph.forcelayout 0.5.0 physics behave acceptably on your own graph.
Frequently asked questions
What is VivaGraphJS?
It is a JavaScript graph drawing library, described in its README as designed to be extensible and to support different rendering engines and layout algorithms. The underlying algorithms live in the separate ngraph modules. It ships SVG and WebGL renderers plus a force-directed layout.
How do I install VivaGraphJS?
The npm package is named vivagraphjs, currently version 0.12.0, so npm install vivagraphjs pulls it in. The README instead tells browser users to include vivagraph.js from the dist folder in the repository.
Does VivaGraphJS support WebGL rendering?
Yes. Construct Viva.Graph.View.webglGraphics() and pass it to the renderer as the graphics option, and the same graph is drawn through WebGL instead of the default SVG. The README's sparse matrix and vk.com examples are WebGL based.
Why does my VivaGraphJS layout look bad at default settings?
The default force-directed parameters do not suit every graph, and the README shows a 3x3 grid rendering poorly until springLength, springCoeff, dragCoeff and gravity are set explicitly. It calls layout tuning the hardest part of using the library.
Can I change the layout parameters while the graph is running?
Yes. The README states you can tune values during the simulation through calls such as layout.simulator.springLength(newValue) and layout.simulator.springCoeff(newValue). The complete list of tunable values is in the ngraph.physics.simulator source file.
Official sources
Add this badge to your README
If you maintain this project, the badge below links readers to this analysis and shows its maintenance status from the daily GitHub snapshot. Paste the markdown into your README; add ?metric=license or ?metric=stars to the image URL for a different field.

[](https://hysenlabs.com/projects/anvaka-vivagraphjs)Star history chart for your README
[](https://hysenlabs.com/projects/anvaka-vivagraphjs)Was this useful?