drawdata for Drawing Machine Learning Data in Notebooks
Draw datasets from within Python notebooks.
At a glance
- What is it?
- drawdata provides notebook widgets for drawing scatter data interactively and retrieving the result through Python. It suits teaching and rapid experimentation, but its documented dataset model is limited to what a single scatter widget exports.
- Who is it for?
- drawdata is appropriate for instructors, students, and developers who need a small, explicit dataset for a notebook exercise or interactive model demonstration. It is a poor fit for projects that require an established data source, a documented generator, or a broad collection of dataset schemas.
- Can I use it commercially?
- Yes. MIT is a permissive licence: you can use, modify and sell software built on it, as long as you keep its copyright and licence notices.
- Is it still maintained?
- Yes. The repository last received commits 109 days ago.
- What is it written in?
- Mainly JavaScript, according to GitHub's language statistics.
Answers come from the project's GitHub data, last synced on November 7, 2026, and from our analysis. They are not legal advice.
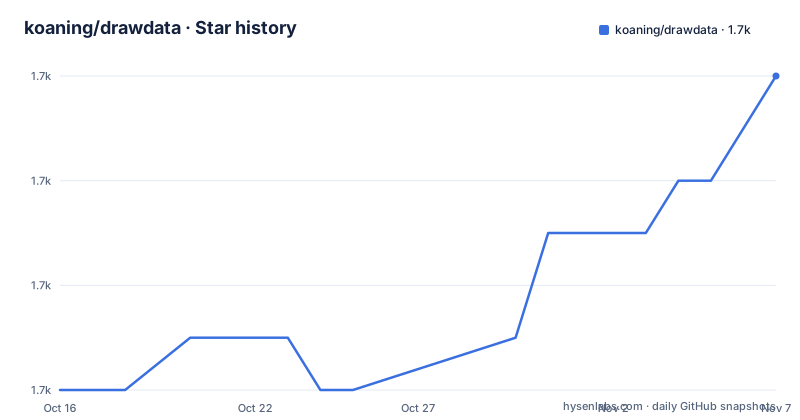
Star history
- koaning/drawdata1,680 ★ · +6
| Repository | 2026-10-16 | 2026-11-07 |
|---|---|---|
| koaning/drawdata | 1.7k | 1.7k |
6 Stars in the last 22 days, measured from the daily GitHub snapshot. Compare with other projects
Editorial analysis
Why drawdata Exists for Notebook-Based Teaching
drawdata solves a narrow but useful problem in Python notebooks: creating a dataset by drawing it instead of loading rows from storage or generating them with a random-data function. The README positions it for teaching machine learning algorithms, where an instructor or learner can place observations visually, inspect their shape, and immediately use them in an explanation or model example.
The main audience is people working in Python notebook environments, including Jupyter, VS Code notebooks, Colab, and marimo. It is especially relevant when the exact data values are not important but their visual structure is. A teacher can draw separable groups for classification, a curved pattern for discussing model limitations, or a single sequence for regression. Those uses follow from the supported drawing and target-export behavior. The README does not provide a catalog of prepared lesson templates or named dataset presets.
This is not a general-purpose dataset builder with documented schemas, joins, validation rules, or import formats. Its value comes from replacing data entry with direct visual composition. That makes it useful for workshops and demonstrations, but it also means the widget is an authoring interface rather than a complete data preparation environment. A notebook user needs to decide what each coordinate and color means because drawdata does not impose a documented semantic schema.
The Widget-to-Data Path in drawdata
The repository metadata describes drawdata as a Python package, while the repository's primary language is JavaScript. The README states that the project uses `anywidget`, which connects the Python package to its notebook widget interface. `pyproject.toml` requires `anywidget>=0.9.2`, and the setuptools package-data configuration includes `static/*.js` and `static/*.css` under the `drawdata` package.
This architecture explains how one Python object can appear as an interactive control and still expose data through Python attributes. The documented flow starts with `ScatterWidget`, continues through interaction with the rendered scatter interface, and ends when the widget exports the current drawing. No network service or external database appears in the documented path.
The output changes at each access point. `widget.data` returns a list of dictionaries. `widget.data_as_pandas` and `widget.data_as_polars` convert the drawing into dataframe objects. `widget.data_as_X_y` packages the result for direct use with scikit-learn. The README does not document field names, serialization details, deletion semantics, export file formats, or whether an empty drawing produces an empty object. Code that depends on those details would need verification against the installed version.
Installing drawdata and Opening the First Scatter Widget
The README says installation occurs through pip and gives `uv` as the installation command. `pyproject.toml` requires Python `>=3.10`, so an older Python environment is outside the declared support range. Installation also brings in `anywidget>=0.9.2`, allowing the Python package to load its JavaScript widget interface.
Use the following command in an environment managed with `uv`:
uv pip install drawdataAfter installation, import `ScatterWidget` and create an instance. Displaying the variable is the README's documented way to place the drawing interface in the notebook cell.
from drawdata import ScatterWidget

widget = ScatterWidget()
widget
The README identifies Jupyter, VS Code, Colab, and marimo as supported environments through the project's use of `anywidget`. It does not describe special kernel configuration, browser requirements, or a separate server process. The repository also includes `scatter-demo.py` and `bar-demo.py`, but the README documents only `ScatterWidget`, so this first-use path stays with the documented scatter widget.
Reading drawdata Results for scikit-learn Workflows
Once points have been drawn, the same `widget` object exposes several representations. This is the main advantage over taking a screenshot or recording coordinates separately: the notebook can continue with the dataset rather than stopping at the visual interface.
Inspect the basic Python representation first:
widget.dataThe README identifies this as a list of dictionaries, although it does not publish the dictionary schema. For dataframe-oriented workflows, either named conversion property can be used:
widget.data_as_pandas
widget.data_as_polars
For a direct machine learning handoff, request the feature matrix and target vector:
X, y = widget.data_as_X_yThat last conversion has a documented interpretive rule. Multiple colors indicate classification, with color serving as the target category. A single color indicates regression, and `y` refers to the y-axis. This rule is convenient for teaching, but it also creates a sharp boundary. A regression exercise drawn with multiple colors would conflict with the documented assumption, and a classification exercise needs its class distinction represented through colors.
The README does not state whether edits are synchronized immediately, whether assigning back to `widget.data` updates the drawing, or how coordinate scaling is normalized. A linked example is described as showing a drawing update triggering a new scikit-learn model, but the README does not specify the callback or synchronization code used to accomplish that update.
drawdata's Limits for Real Data Projects
drawdata is the wrong tool when the objective is to reproduce a dataset from a documented source or preserve a controlled production schema. Manual drawing introduces the observations a user sees, but the README documents no provenance model, versioning for individual drawings, validation layer, sampling controls, or collaboration format. Based on the public API, it should not be treated as a substitute for a database, an experiment tracker, or a maintained dataset pipeline.
The color-based classification rule and y-axis-based regression rule also limit experimental design. The README does not document support for multiple target columns, named continuous features, missing values, categorical encoding beyond the color distinction, or schema constraints. Adding those requirements to a notebook would move beyond the documented API.
Notebook rendering is another explicit dependency. The package supports environments through `anywidget`, but the README does not include browser compatibility details, offline deployment instructions, or a fallback for environments where JavaScript widgets cannot execute. A terminal-only Python session would not fit the documented interaction model because drawing requires a notebook interface.
The repository contains a `tests/` directory, but no test results, supported-browser matrix, or detailed compatibility claims are published in the README. The defensible engineering judgement is that drawdata addresses teaching interactions and quick demonstrations, not dependable dataset governance.
How drawdata Differs from Generator-Based Python Workflows
A real alternative is to construct a notebook dataset with Python data tools and render its values through a dataframe or plotting library. The approaches differ at the input stage. Generator-based workflows create arrays from code, files, APIs, or random operations. Their results can be reproduced from the generating code, while a manually drawn dataset begins as notebook interaction state.
drawdata places visual authoring before dataframe or scikit-learn export. That ordering helps a learner see the data before consuming it. It is less suitable when the data itself must be generated by version-controlled code. A conventional workflow does not depend on `anywidget`, does not expose the same `ScatterWidget.data_as_X_y` property, and requires the notebook author to define serialization and coordinates separately.
The live demo linked by the README also provides a route for evaluating the interaction without installing anything. That is useful for reviewing the widget experience, but the README does not explain how to export or persist a drawing from the hosted page. drawdata's concrete difference is the notebook-native path from drawing to several Python representations, not a documented advantage in model accuracy or dataset quality.
Maintenance, Packaging, and Upgrade Boundaries for drawdata
The repository is not archived, and its last push was on 2026-07-21. That records recent repository activity. The listed release history includes `0.3.4` dated 2026-01-07, while `pyproject.toml` declares version `0.5.2`. The README does not explain the discrepancy, so release and package availability should be checked before a team standardizes a version.
The MIT license permits reuse and modification under its terms, subject to the text in `LICENSE`. This review does not interpret those terms as legal advice. For dependency maintenance, the declared runtime floor is the clearest constraint: deploying drawdata requires Python `>=3.10` and `anywidget>=0.9.2` or a later compatible release.
Development also includes a JavaScript bundle. The `Makefile` has an `install` target that downloads esbuild `v0.19.11`, installs drawdata in editable mode, and installs marimo. Its `js` target watches `js/scatter_widget.js` and writes `drawdata/static/scatter_widget.js`. These are contributor commands rather than the ordinary installation path shown in the README. The repository documentation does not describe release verification, migration notes, or rollback procedures for widget changes, so those remain explicit adoption questions.
Editorial conclusion
drawdata is appropriate for instructors, students, and developers who need a small, explicit dataset for a notebook exercise or interactive model demonstration. It is a poor fit for projects that require an established data source, a documented generator, or a broad collection of dataset schemas. Before adoption, verify compatibility with the intended notebook environment, inspect how `data_as_X_y` maps colors and axes for the exercise, and confirm that version `0.5.2` published for this repository matches the release stream available to your team.
Frequently asked questions
Which Python version does drawdata require?
The repository's `pyproject.toml` requires Python `>=3.10`. Its classifiers list Python 3.10, 3.11, and 3.12.
Which notebook environments support drawdata?
The README says the widgets should work in marimo, Jupyter, VS Code, and Colab because drawdata uses `anywidget`. It does not publish separate compatibility versions for each environment.
How does drawdata convert a drawing for scikit-learn?
Use `X, y = widget.data_as_X_y`. Multiple colors indicate classification, while one color indicates regression and makes `y` refer to the y-axis.
Official sources
Add this badge to your README
If you maintain this project, the badge below links readers to this analysis and shows its maintenance status from the daily GitHub snapshot. Paste the markdown into your README; add ?metric=license or ?metric=stars to the image URL for a different field.

[](https://hysenlabs.com/projects/koaning-drawdata)Star history chart for your README
[](https://hysenlabs.com/projects/koaning-drawdata)Was this useful?