D3 Graph Theory: Interactive Lessons for Graph Fundamentals
:boom: Interactive and colorful :art: graph theory tutorials made using d3.js :zap:
At a glance
- What is it?
- D3 Graph Theory is a browser-based tutorial for learning graph theory through interactive D3.js visualizations. It covers 22 topics, from vertices and degree to spanning trees, but provides no installation instructions or formal releases.
- Who is it for?
- D3 Graph Theory suits learners who want a visual introduction to the listed concepts and have no need for a packaged curriculum API. It is unsuitable for developers seeking a library, formal exercise system, release-managed upgrades, or documented local deployment.
- Can I use it commercially?
- Yes. MIT is a permissive licence: you can use, modify and sell software built on it, as long as you keep its copyright and licence notices.
- Is it still maintained?
- Yes. The repository last received commits 85 days ago.
- What is it written in?
- Mainly JavaScript, according to GitHub's language statistics.
Answers come from the project's GitHub data, last synced on November 7, 2026, and from our analysis. They are not legal advice.
Star history
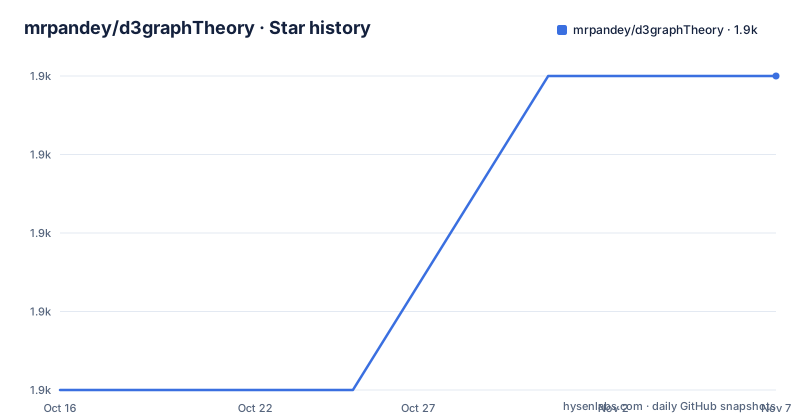
- mrpandey/d3graphTheory1,856 ★ · +4
| Repository | 2026-10-16 | 2026-11-07 |
|---|---|---|
| mrpandey/d3graphTheory | 1.9k | 1.9k |
4 Stars in the last 22 days, measured from the daily GitHub snapshot. Compare with other projects
Editorial analysis
What D3 Graph Theory Covers
D3 Graph Theory addresses beginners who want an interactive introduction to graph theory rather than a reference implementation of graph algorithms. Its intended audience is broad: anyone learning how graphs represent relationships between objects can use the site to explore vertices, edges, graph properties, walks, connectivity, coloring, and trees. The README describes the visual format as a quick and interactive introduction, and that characterization matters because the project is organized as a sequence of web pages rather than as an installable algorithm package.
The completed curriculum currently contains 22 linked units. The early material establishes vertices and edges, graph order and size, vertex degree, degree sequences, graphic sequences, the Havel-Hakimi algorithm, and the pigeonhole principle. Later units move into regular, complete, bipartite, and complete bipartite graphs. The remaining scope includes walks, connectivity, Eulerian circuits and trails, graph coloring, k-colorable graphs, chromatic number, trees, rooted trees, and spanning trees.
This range makes the project useful for organized introductory study. A learner can begin with basic graph vocabulary and continue into structural properties and named algorithms. However, the README does not define prerequisites, a recommended lesson order beyond the numbered table, exercise requirements, assessment criteria, or a completion standard. The topic list is substantial, but it should not be confused with a complete graph theory curriculum. Matrix theory, advanced graph theory, complexity analysis, and many standard algorithm topics are not listed.
The project also distinguishes planned work from completed content. Planar graphs, Prim's algorithm, and Kruskal's algorithm remain unchecked in the upcoming topics list. Because no GitHub releases are available, there is no documented release version that tells readers when a stable syllabus was assembled or which planned units may appear after the current master branch.
Repository Structure and Browser Delivery
The repository is a front-end web project rather than a conventional npm package. Its top level includes `index.html` and `unit.html`, separate `css/` and `js/` directories, `img/` for images, `fonts/` for typefaces, and `ch/` for an additional content area whose purpose is not documented in the README. There is no `package.json` in the listed repository entries, so the repository does not establish a package manifest, dependency installation workflow, build script, test suite, or command-line interface.
The two HTML files are the clearest visible entry points. The README links the general site to `https://d3gt.com` and links each lesson through a `unit.html` URL followed by a topic identifier. Examples include `unit.html?vertices-and-edges`, `unit.html?havel-hakimi`, and `unit.html?spanning-tree`. This indicates that lesson selection is represented in the URL query string. The README does not document how query values are parsed, which JavaScript module owns that behavior, or whether pages can be navigated without a web server.
The repository attributes the visual work to D3.js and also credits MathJax, JQuery, Bootstrap, Modal Logic Playground, and an existing Havel-Hakimi implementation. Those attribution links establish dependencies or outside projects used by the site, but the available repository layout does not show their exact integration points. It would be unsafe to claim that every named library controls the lesson content or graph layout.
Based on the repository layout, adoption means understanding a browser-delivered teaching site, not importing `d3graphTheory` into an application. There is no documented API for loading lesson data, constructing graphs, executing an algorithm, or retrieving results. Developers seeking those capabilities would be choosing the wrong project.
Opening the Hosted Lessons and Starting a Study Session
The README provides a hosted entry point but no local installation commands. A first use therefore starts in a browser with the published site:
https://d3gt.com/The reader should see the project landing page linked from the repository README. If the hosted service is unavailable, the README provides no Docker workflow, package-manager command, web-server invocation, or deployment recipe. The repository's static-looking `index.html`, `unit.html`, `css/`, `js/`, `img/`, and `fonts/` entries suggest browser assets, but the documentation does not confirm the required local server configuration.
From the site, the learner can open the first lesson with the URL published in the README:
https://d3gt.com/unit.html?vertices-and-edgesThat page is documented as covering vertices and edges, the basic elements of the graph model. A direct link to the degree lesson is also published:
https://d3gt.com/unit.html?degree-of-vertexEach URL uses the same `unit.html` page with a different query identifier. The README does not explain interaction controls, keyboard shortcuts, answer checking, saved progress, or whether state persists between visits. A learner can follow the numbered links, but the project documentation does not prescribe that sequence.
For a local checkout, inspect `index.html` and `unit.html` first, then open the entry point in a browser only if its referenced paths resolve as expected. This is an inspection method, not a documented installation command. The absence of setup instructions should not be filled with invented flags such as `npm install`, `npm start`, or a guessed development-server port.
Visual Lessons Across Graph Structures and Algorithms
The topic progression shows two broad teaching modes: graph properties and graph transformations or classifications. Degree, order, size, regularity, completeness, bipartiteness, connectivity, and coloring describe or classify graph structures. Walks, Eulerian circuits, Eulerian trails, spanning trees, and Havel-Hakimi represent processes or constructions that a learner can follow through examples. The README does not expose the internal algorithm for each visual, so the concrete teaching interaction remains unspecified.
The Havel-Hakimi unit has a separate attribution to a project named `hh`, while Modal Logic Playground is also credited. That distinction may matter to a technical reader because the lesson could be adapted from or connected to outside projects. The README does not state whether users can edit graph data, supply their own examples, step through an execution, or view pseudocode beside the visualization. These missing controls limit what can be promised about the learning experience.
The breadth of linked units also creates a maintenance consideration for lesson accuracy. Each page represents conceptual content that may depend on JavaScript behavior, mathematical notation, and diagram assets. Updating one topic requires more than changing a topic-table entry, although the repository does not document the authoring workflow or content schema. `WORKING.md` and `ROADMAP.md` appear in the repository, but their contents are not available here, so they cannot establish the process or priority of future work.
The repository contains formatting configuration files, including `.prettierrc` and `.jshintrc`. Their presence indicates repository-level JavaScript and formatting configuration, but it does not prove that a contributor can run a documented linting or formatting command. No test entries or executable scripts are listed. For an educational project, the absence of visible automated tests is a meaningful adoption constraint, especially for changes involving graph calculations.
Limitations for Formal Courses and Application Development
The clearest limitation is that D3 Graph Theory is a tutorial site, not a graph-theory library. The README lists visualizations and topics, but no importable module, graph data structure, traversal function, solver, command, or documented API. Code that needs breadth-first search, depth-first search, shortest paths, flow networks, or graph serialization would not be served by the documented project.
The project is also weak as a formal course platform based on the README. There is no stated assessment system, exercise submission, grading mechanism, progress tracking, certificate, instructor dashboard, or accessibility conformance claim. The site uses visual interaction, but the README does not state whether all lessons have equivalent text explanations, whether diagrams work without animation, or whether content can be completed using assistive technology. Those omissions prevent a confident accessibility claim.
Planned topics introduce a syllabus boundary. Planar graphs, Prim's algorithm, and Kruskal's algorithm are named but not marked complete. Readers should not assume that clicking through all current units covers the standard spanning-tree algorithm sequence. The Havel-Hakimi topic is present, but that does not imply a broader algorithm implementation.
A second operational risk comes from deployment. The repository has no GitHub releases, so upgrades are tied to repository contents rather than published versions. There is no documented migration note or compatibility statement for D3.js and the other credited libraries. A fork could therefore require direct inspection of `js/`, `css/`, and both HTML entry points before anyone can assess dependency versions or the effort needed to deploy changes.
Alternatives to a D3 Tutorial and Maintenance Choices
The practical alternative is a conventional graph-theory reference or a graph algorithm library, depending on the intended use. A written reference can provide definitions, proofs, notation, and worked problems in a stable sequence. A graph library instead exposes graph structures and operations to application code. D3 Graph Theory offers a different approach: browser visualizations centered on the listed introductory concepts. It should be compared with those alternatives by learning format and intended output, not treated as a substitute for either.
For example, a developer needing to execute graph algorithms would choose a library whose public interface exposes graph construction and operations, while D3 Graph Theory exposes lesson pages through `unit.html` query identifiers. A learner who values visual explanations may prefer the interactive approach, but should first confirm that the visualization mechanics meet their needs. The README does not document interactivity depth, solved examples, quizzes, or algorithm execution controls.
The repository is not archived, and its last push was on 2026-08-15. That supports treating the repository as recently changed, but it does not establish a release cadence or promise of regular updates. The README says new topics are added from time to time without defining an interval. There are no GitHub releases, so an adopter cannot identify a versioned teaching release from release history.
The MIT License permits use, modification, distribution, and sublicensing of the licensed software under its conditions, including preservation of copyright and license notices. That is a license summary, not legal advice. For a fork or redistributed lesson, the operator should also account for separately licensed libraries and attributed third-party content. The README identifies several dependencies but does not inventory all versions or licenses.
Editorial conclusion
D3 Graph Theory suits learners who want a visual introduction to the listed concepts and have no need for a packaged curriculum API. It is unsuitable for developers seeking a library, formal exercise system, release-managed upgrades, or documented local deployment. The first project-specific checks should be whether the 22 hosted units match the intended syllabus and whether the JavaScript and CSS assets can be served from the `index.html` and `unit.html` entry points.
Frequently asked questions
How do I install D3 Graph Theory locally?
The README does not provide local installation steps, a `package.json`, or a documented web-server command. It directs users to the hosted site at `https://d3gt.com`; a local setup would require inspecting `index.html`, `unit.html`, and the referenced asset directories.
Which graph theory topics does D3 Graph Theory cover?
The completed list contains 22 units, including vertices and edges, degree, Havel-Hakimi, regular and complete graphs, bipartite graphs, connectivity, Eulerian circuits and trails, graph coloring, trees, rooted trees, and spanning trees. Planar graphs, Prim's algorithm, and Kruskal's algorithm are listed as upcoming.
Is D3 Graph Theory a JavaScript graph algorithm library?
No library API is documented. It is a JavaScript front-end project for interactive graph theory tutorials, with lesson links based on `unit.html` and topic identifiers.
Official sources
Add this badge to your README
If you maintain this project, the badge below links readers to this analysis and shows its maintenance status from the daily GitHub snapshot. Paste the markdown into your README; add ?metric=license or ?metric=stars to the image URL for a different field.

[](https://hysenlabs.com/projects/mrpandey-d3graphtheory)Star history chart for your README
[](https://hysenlabs.com/projects/mrpandey-d3graphtheory)Was this useful?