Applied Empirical Methods at Yale: nine problem sets coded from scratch, with solutions in R and no license file
Repo for Yale Applied Empirical Methods PHD Course
At a glance
- What is it?
- paulgp/applied-methods-phd is the public course repository for a Yale PhD econometrics course: lecture slides, lecture notes, homework, homework solutions, papers and exam questions as PDFs. It teaches intuition for practitioners' methods and expects you to build estimators yourself.
- Who is it for?
- Use this repository if you are a graduate student or empirical researcher who wants lecture slides on potential outcomes, regression, discrete choice and related topics, and who is willing to code estimators by hand in R. Skip it if you want a software package or a formal proof-first text, since the instructor says formal detail is kept to what is necessary.
- Can I use it commercially?
- Not without permission. GitHub finds no licence file in the repository, and without a licence all rights are reserved by default: you may read the code but not reuse it. Check the README, or ask the authors, before using it.
- Is it still maintained?
- Activity is slowing. The repository last received commits 6 months ago.
- What is it written in?
- Mainly TeX, according to GitHub's language statistics.
Answers come from the project's GitHub data, last synced on November 6, 2026, and from our analysis. They are not legal advice.
Star history
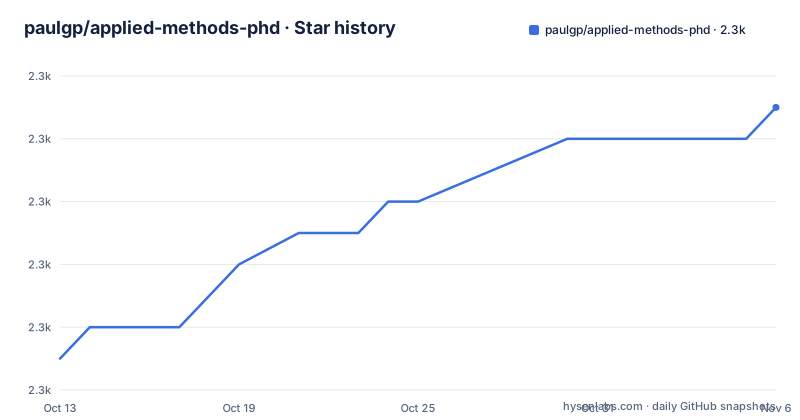
- paulgp/applied-methods-phd2,265 ★ · +8
| Repository | 2026-10-13 | 2026-11-06 |
|---|---|---|
| paulgp/applied-methods-phd | 2.3k | 2.3k |
8 Stars in the last 24 days, measured from the daily GitHub snapshot. Compare with other projects
Editorial analysis
A course repository, not software
The top-level entries show what this repository is: exam_questions/, homework-solutions/, homework/, lecture_notes/, lectures/ and papers/, plus syllabus.pdf and syllabus.tex. The primary language is TeX because the slides and notes are LaTeX sources, with PDFs linked from the README through nbviewer. There is nothing to install, build or import.
The README lists two course pages. One is this GitHub repository. The other is a Yale course site on instructure.com, marked for Yale students only. Course videos are available on a YouTube playlist, which gives outside readers a lecture-by-lecture route that the Yale-only site does not.
The repository declares no license, so the metadata shows it as unknown. That does not stop you reading the slides, but it leaves reuse unclear. If you want to adapt slides for your own teaching or redistribute the notes, ask the author first, because nothing in the repository grants those rights. The last push was on 2026-04-30.
The course teaches intuition for practitioners, with formal detail kept short
The course description states its audience: graduate students interested in econometric methods used in empirical research. The aim is an overview of different empirical methods with an emphasis on practical implementation. The instructor provides lecture slides and notes, and background papers that are largely optional.
The second paragraph sets the tone. The instructor focuses on providing his understanding and intuition of empirical methods as practitioners use them. That means little time on formal details beyond what is necessary, and more on the intuitive framework behind the papers. He also says he will try to communicate how the topics fit together.
Three hoped-for outcomes close the description. Students are exposed to a wide range of methods and know their pros and cons, plus where to look when they want to use one. The jargon of econometric methods becomes less intimidating, so that hearing someone say they use semiparametric inference bothers you for not using clearer language. And students approach papers wanting to disentangle the underlying framework and the experiment behind its causal inferences. The README calls this a course focused on communication and artisanship.
Nine problem sets that refuse lm(y ~ x)
The assignments section says there are problem sets most weeks, nine in total. They mix theoretical calculations with computer exercises that analyze data sets. You can use any computer package, but the solutions are handed out written in R.
The coding rule is the sharp part. Assignments are often expected to be coded from scratch, and the instructor will say when canned packages are appropriate. For a regression, he is not looking for the output of lm( y ~ x). He expects you to construct two matrices and calculate the estimates from them. Good coding practice is also expected, and the README warns that this will be challenging for people inexperienced at programming. No extra coding instruction is given beyond what is covered in class.
For guidance in R the README lists Introduction to Base R, R for Data Science and a data visualization guide at socviz.co, crediting Max Kasy for organizing them. The homework folder holds the problem sets as PDFs and homework-solutions/ holds the answers. A self-study reader can therefore attempt each set before checking the solutions.
Late work is refused, and grades are split evenly across sets
Some rules in the README only make sense for enrolled students, and a self-study reader should know which. Late problem sets are not accepted, so that solutions can be posted quickly on the course webpage. If you anticipate difficulty with a deadline, you can ask for the problem set earlier to get more time.
Collaboration is allowed. You can work together on the problem sets and discuss them with classmates, but you must write up the results individually and hand them in separately. Grades are based on the problem sets, divided evenly across them.
For someone outside Yale, none of this binds you, but it explains the structure of the folders. Each homework PDF is meant to be a weekly unit of work, and the solutions folder exists because they were posted quickly. The README does not say when in the term the solutions were released, or whether every set has a posted solution, so check homework-solutions/ against the nine sets before assuming complete coverage.
The lecture list runs from potential outcomes to duration models
The README links the full syllabus as syllabus.pdf and lists lectures in three visible groups. Causality, Statistics, and Economics has four lectures: Potential Outcomes and Directed Acyclic Graphs, Research Design, Randomization, and Design-Based Inference, Propensity Scores, and Interference, Spillovers and Dynamics. Linear Regression has four more: Inference, Semiparametrics and Visualization, Quantile Regression and Penalized Regression Models.
The third group is Likelihood Methods, which begins with Binary Discrete Choice, GLM and Computational Methods, followed by Multiple Discrete Choices and Duration models. The README text is cut off in the middle of the Duration models link, so lectures after that are in the syllabus, not in the list as shown here.
Homework is attached to particular lectures. Homework 1 sits with the randomization lecture, homework 2 with the interference lecture, homework 3 with the semiparametrics lecture and homework 4 with penalized regression. Lecture notes exist for some lectures and not others: the quantile regression and penalized regression entries show slides and, for the latter, a homework, with no lecture notes link in the list.
Four books carry the reading list, and it says it is partial
The Main References section calls itself a partial list of interesting and useful books touched during the course. It names four. Angrist and Pischke, Mostly Harmless Econometrics. Scott Cunningham, Causal Inference: The Mixtape, with a free site at mixtape.scunning.com. Benjamin T. Miller and Peter M. Aronow, Foundations of Agnostic Statistics. Kieran Healy, Data Visualization: A Practical Introduction, at socviz.co.
The papers/ folder holds the background papers the course description calls largely optional. The README does not list them by title. It does not say which of them are required for the problem sets, so a reader working alone should open the folder and match papers to lectures by name.
A link in the third group deserves a check before you rely on it. The Multiple Discrete Choices entry points its lecture notes link at the file named 09_discrete_choice_1_notes.pdf, the same file as the previous lecture. That looks like a copy slip in the README. The slides link for that lecture goes to 10_discrete_choice_2.pdf, so use the slides until the notes link is fixed.
What the repository leaves you to supply
A few things are absent. There is no lecture-by-lecture reading assignment, no environment file for the R solutions and no list of R packages, so you install whatever the solution code needs. The README does not state R version requirements. Data sets for the computer exercises are not described either, which means the homework PDFs are where you find out what to download.
The repository is a snapshot of one course, not an ongoing curriculum with a changelog. It is not archived, but the last push was on 2026-04-30, and there are no GitHub releases to pin. The README does not name the term or year in which the course was taught.
As a reading plan, start with the video playlist and the first lecture slides on potential outcomes, then attempt homework 1 with matrices built by hand before opening its solution. If the topic is econometric methods in empirical work, that order follows how the instructor himself says he teaches it.
Editorial conclusion
Use this repository if you are a graduate student or empirical researcher who wants lecture slides on potential outcomes, regression, discrete choice and related topics, and who is willing to code estimators by hand in R. Skip it if you want a software package or a formal proof-first text, since the instructor says formal detail is kept to what is necessary. Before you rely on any file, check the missing license and the LaTeX source, then open syllabus.pdf to see the full lecture order, because the README list is cut short.
Frequently asked questions
What is the Applied Empirical Methods course repository?
It is the public materials for a Yale PhD course: lecture slides and notes, problem sets, solutions in R, papers and exam questions. Course videos are on a YouTube playlist.
Do I need R to follow the applied-methods-phd homework?
You can use any computer package, but the solutions are handed out written in R. The instructor expects estimates built from matrices instead of lm( y ~ x).
Does applied-methods-phd have a license?
The repository declares none, so its license shows as unknown. The README grants no reuse terms, so ask the author before redistributing the slides or notes.
Official sources
Add this badge to your README
If you maintain this project, the badge below links readers to this analysis and shows its maintenance status from the daily GitHub snapshot. Paste the markdown into your README; add ?metric=license or ?metric=stars to the image URL for a different field.

[](https://hysenlabs.com/projects/paulgp-applied-methods-phd)Star history chart for your README
[](https://hysenlabs.com/projects/paulgp-applied-methods-phd)Was this useful?