PyQtGraph is the Qt plotting library scientific Python quietly runs on
Fast data visualization and GUI tools for scientific / engineering applications
At a glance
- What is it?
- A pure-Python 2D and 3D graphics library built on Qt, numpy and OpenGL, with 508 open issues and a used-by list that includes Orange3, PyMeasure, ACQ4 and Joulescope. Also a license field that says NOASSERTION while the packaging metadata says MIT.
- Who is it for?
- PyQtGraph's case rests on being the layer between numpy arrays and an interactive, hardware-accelerated window, which is exactly the gap matplotlib leaves when you need live panning, ROI dragging and 3D scenes at interactive rates. If you are starting a new scientific GUI, install the released version from conda-forge or PyPI and run the examples browser before writing anything, because the example set is the de facto documentation.
- Can I use it commercially?
- Check first. The repository uses a licence we do not classify automatically, so read its LICENSE file before any commercial use.
- Is it still maintained?
- Yes. The repository last received commits 1 day ago.
- What is it written in?
- Mainly Python, according to GitHub's language statistics.
Answers come from the project's GitHub data, last synced on November 7, 2026, and from our analysis. They are not legal advice.
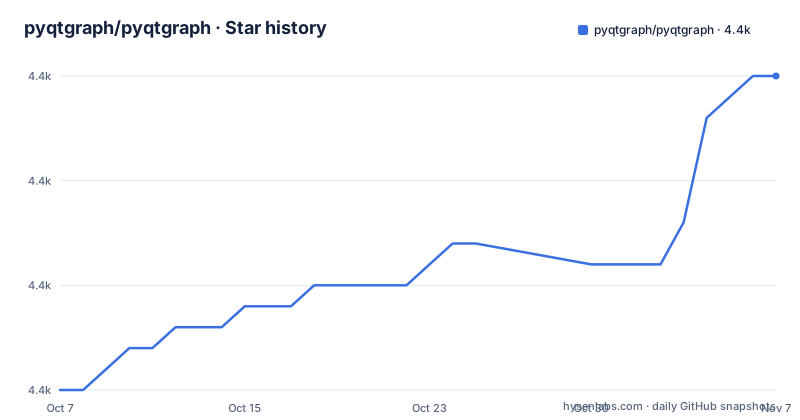
Star history
- pyqtgraph/pyqtgraph4,440 ★ · +15
| Repository | 2026-10-07 | 2026-11-07 |
|---|---|---|
| pyqtgraph/pyqtgraph | 4.4k | 4.4k |
15 Stars in the last 31 days, measured from the daily GitHub snapshot. Compare with other projects
Editorial analysis
What the project claims, in its own words
The README describes PyQtGraph as a pure-Python graphics library that uses the Qt framework, intended for mathematics, scientific and engineering applications. The performance argument follows immediately: despite being written entirely in Python, the library is fast because it leans on numpy for number crunching, Qt's GraphicsView framework for 2D display, and OpenGL for 3D display. That is the whole architectural thesis, and it is a sensible one. The library does not reimplement plotting maths; it arranges numpy data into Qt graphics primitives.
The GitHub description is blunter: fast data visualization and GUI tools for scientific and engineering applications. Both framings point at the same niche, which is worth stating precisely because PyQtGraph is not a general-purpose charting library. It has no notion of a dashboard or a business report. What it has is a live, interactive scientific instrument surface.
The strongest evidence for that positioning is the used-by list in the README, which is long and specific: ACQ4, Orange3, PyMeasure, Joulescope, ephyviewer, rapidtide, STDF-Viewer, PatchView, neurotic, EnMAP-Box, GraPhysio and others. These are instrument control packages, neuroscience viewers and materials-science tools, not web products. If your application needs live interaction with arrays, that list is a better fit test than any feature comparison.
Supported versions are decided by a formal spec, not by feel
PyQtGraph has adopted SPEC 0 from scientific-python, and the consequences are spelled out. The project supports Python versions released within the last 3 years, NumPy, SciPy and matplotlib versions released within the last 2 years, and Qt5 5.15 or Qt6 6.8 or newer. Concretely that means Python 3.12+, Qt 5.15 or 6.8+, a binding of PyQt5, PyQt6 or PySide6, and numpy 2.2 or newer.
The packaging metadata matches: `pyproject.toml` declares `requires-python = ">=3.12"` and lists `numpy>=2.2.0` along with `colorama` as the only hard dependencies. That last point matters for anyone choosing between PyQtGraph and a plotting dependency with a heavier footprint: the required install is numpy plus a Qt binding you already have.
Optional dependencies are the feature switchboard
Rather than bundle heavy scientific packages, PyQtGraph makes them opt-in, and the README documents the mapping as a table. SciPy brings image processing through `ndimage` and array filtering through `signal`. h5py adds export in hdf5 format. colorcet adds a collection of perceptually uniform colormaps. matplotlib adds export of a PlotItem in a matplotlib figure and brings matplotlib's colormap collection. cupy adds CUDA-enhanced image processing, numba adds faster image processing, and jupyter_rfb adds Jupyter Notebook support with a Binder launch.
That design explains why the core dependency list stays at two entries. An application that only needs live line plots never installs SciPy; one that needs GPU image processing opts into cupy and pays for it explicitly.
The same choice shows up in benchmarking. The README describes support for the `asv` benchmarking library, and instructs CUDA users to edit `asv.conf.json` and add an entry so CUDA variants get measured:
    "req": {
      "pyqt6": [""],
      "pyqt5": [""],
      "PySide6-Essentials": [""],
      "numba": [""],
      "cupy-cuda##x": [""]
    }
The README also warns that because many Python and Qt binding combinations are tested, running the full benchmark suite takes a while. That is an honest warning from a project that maintains a cross-binding matrix.
Getting it installed and finding your way around
There are three documented install paths, and they serve different needs:
pip install pyqtgraph
conda install -c conda-forge pyqtgraph
pip install git+https://github.com/pyqtgraph/pyqtgraph@master
The first is the released version from PyPI, the second is the conda-forge build, and the third tracks the development branch. Many Linux distribution repositories also carry release versions. For a scientific environment that already uses conda-forge for scipy and h5py, the conda route avoids pip resolving a second, conflicting numpy.
For orientation the README points at the examples application rather than a tutorial, launched with `python -m pyqtgraph.examples`. That is the honest advice for this library: the API surface is large and item-oriented, and reading working examples is faster than learning it from a reference. The examples also carry package data declared in `pyproject.toml`, including compressed optics presets under `pyqtgraph.examples`, so a trimmed install can miss example assets.
Official documentation lives at pyqtgraph.readthedocs.io, and the README carries a readthedocs badge for it. Support is split across a GitHub issue tracker, a Google group, StackOverflow, GitHub Discussions and a Python Discord server, which is a realistic support surface for a library this size.
0.14.0 is where 3D stopped being experimental
The latest release is 0.14.0, published 2025-11-16; the two before it were 0.13.7 on 2024-04-29 and 0.13.6 on 2024-04-22. The project keeps a CHANGELOG file at the root, linked from pyproject.toml.
GitHub says NOASSERTION, the package metadata says MIT
GitHub reports no recognized license identifier for this repository. The packaging metadata says otherwise and more specifically: `pyproject.toml` declares `license = "MIT"` and `license-files = ["LICENSE.txt"]`, and the tree contains a `LICENSE.txt` at the root. Both facts sit in the repository.
The practical instruction is the same either way: read `LICENSE.txt`, and if you redistribute PyQtGraph in a commercial or closed-source product, confirm the terms yourself rather than relying on what a metadata field reports.
The rest of the repository structure is conventional for a scientific Python project: `pyqtgraph/` for the package, `tests/` and `test.py`, `doc/` for the Sphinx documentation, `benchmarks/` for the asv suite, `binder/` for the notebook environment, `tools/`, `tox.ini`, `.pre-commit-config.yaml`, `.readthedocs.yaml` and a `CHANGELOG`. The project was last pushed on 2026-11-02, is not archived, and has 4,431 stars with 527 open issues. An open issue count that size on a library this widely depended on is worth reading as adoption, not as neglect.
Editorial conclusion
PyQtGraph's case rests on being the layer between numpy arrays and an interactive, hardware-accelerated window, which is exactly the gap matplotlib leaves when you need live panning, ROI dragging and 3D scenes at interactive rates. If you are starting a new scientific GUI, install the released version from conda-forge or PyPI and run the examples browser before writing anything, because the example set is the de facto documentation. Two checks before you commit: the repository's license identifier reads NOASSERTION on GitHub while `pyproject.toml` declares `license = "MIT"` with `LICENSE.txt`, so treat the file as authoritative, and code written against older PyQtGraph needs a look at the CHANGELOG before upgrading to 0.14.0.
Frequently asked questions
Is PyQtGraph better than matplotlib for interactive plots?
They target different things. Matplotlib is a rendering library with an optional interactive backends, while PyQtGraph is a live Qt widget set built around numpy data, so panning, region-of-interest dragging and 3D scenes stay interactive without a separate GUI framework. PyQtGraph also accepts matplotlib as an optional dependency for exporting a PlotItem into a matplotlib figure.
Which Qt bindings and Python versions does PyQtGraph support?
PyQt5, PyQt6 and PySide6, on Qt 5.15 or Qt6 6.8 or newer, with Python 3.12 or newer and numpy 2.2 or newer. The project follows SPEC 0, which ties support windows to the last 3 years of Python releases and the last 2 years of NumPy, SciPy and matplotlib releases.
How do I enable faster image processing in PyQtGraph?
Install one of the optional backends listed in the README. cupy gives CUDA-enhanced image processing, numba gives faster image processing, and scipy provides image processing through ndimage plus filtering through signal. The core install deliberately depends only on numpy and colorama.
What happened to MetaArray and MultiPlotItem in 0.14.0?
0.14.0 was released on 2025-11-16; check the CHANGELOG file at the repository root, linked from pyproject.toml, before upgrading code that uses these APIs.
Official sources
Add this badge to your README
If you maintain this project, the badge below links readers to this analysis and shows its maintenance status from the daily GitHub snapshot. Paste the markdown into your README; add ?metric=license or ?metric=stars to the image URL for a different field.

[](https://hysenlabs.com/projects/pyqtgraph-pyqtgraph)Star history chart for your README
[](https://hysenlabs.com/projects/pyqtgraph-pyqtgraph)Was this useful?