gt for R: building display tables from six table parts, with three output formats
Easily generate information-rich, publication-quality tables from R
At a glance
- What is it?
- The gt package turns a tibble or data frame into a formatted table out of a fixed set of parts: header, stub, column labels, spanners, body and footer. This look covers how a gt pipeline is put together, which formats it renders, and what it leaves to other packages.
- Who is it for?
- gt suits R users who want presentation tables built from named parts and rendered to HTML, LaTeX or RTF, and who already have their data in a tibble or data frame. It is the wrong tool if you need a format outside those three, or if you expect it to compute summary statistics for you.
- Can I use it commercially?
- Check first. The repository uses a licence we do not classify automatically, so read its LICENSE file before any commercial use.
- Is it still maintained?
- Yes. The repository last received commits 23 days ago.
- What is it written in?
- Mainly R, according to GitHub's language statistics.
Answers come from the project's GitHub data, last synced on November 6, 2026, and from our analysis. They are not legal advice.
Star history
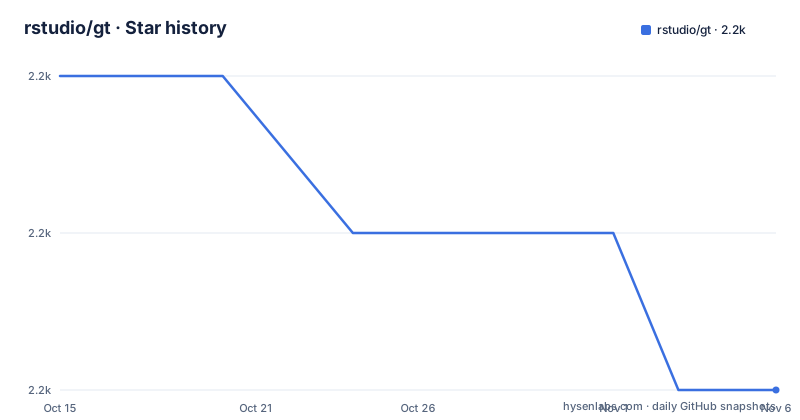
- rstudio/gt2,161 ★ · -2
| Repository | 2026-10-15 | 2026-11-06 |
|---|---|---|
| rstudio/gt | 2.2k | 2.2k |
-2 Stars in the last 22 days, measured from the daily GitHub snapshot. Compare with other projects
Editorial analysis
Every gt table is assembled from six named parts
The gt philosophy is that a wide variety of useful tables can be constructed from a cohesive set of table parts. The parts are the table header, the stub, the column labels, the spanner column labels, the table body and the table footer. Each later function you call targets one of those parts, which is why the API reads as a chain of small steps rather than one large function with dozens of arguments.
The starting point is always table data, either a tibble or a data frame. You then decide how to compose the gt table with the elements and formatting the task needs. The consequence is that gt never reshapes your data for you: if the structure you want to display is not already a tibble or data frame, you convert it first.
The sp500 example shows how filtering, formatting and labelling are separate steps
The README example builds a table from the included sp500 dataset with the native pipe:
library(gt)

# Define the start and end dates for the data range
start_date <- "2010-06-07"
end_date <- "2010-06-14"

# Create a gt table based on preprocessed
# `sp500` table data
sp500 |>
  dplyr::filter(date >= start_date & date <= end_date) |>
  dplyr::select(-adj_close) |>
  gt() |>
  tab_header(
    title = "S&P 500",
    subtitle = glue::glue("{start_date} to {end_date}")
  ) |>
  fmt_currency() |>
  fmt_date(columns = date, date_style = "wd_m_day_year") |>
  fmt_number(columns = volume, suffixing = TRUE)
Row filtering and column dropping happen before gt() is called, through dplyr, and the subtitle text is built with glue. gt itself starts at gt(). So the example needs those two packages to be installed even though neither is part of gt.
Only HTML, LaTeX and RTF are named as output formats
A table is rendered by printing it at the console, including it in an R Markdown document, or exporting to a file with gtsave(). The README says gt currently supports the HTML, LaTeX and RTF output formats, and names no others.
That is a hard boundary for anyone planning a pipeline. If your deliverable is a format outside those three, the README gives no route to it, and you should check the Reference section on the documentation website before committing. Printing at the console is also a different path from gtsave(): the first is for looking, the second is how you get a file onto disk. Anyone searching for how to save a gt table will find gtsave() as the named answer.
Eighteen bundled datasets exist for examples, not for your own analysis
The package ships 18 datasets: countrypops, sza, gtcars, sp500, pizzaplace, exibble, towny, peeps, films, metro, gibraltar, constants, illness, reactions, photolysis, nuclides, rx_adsl and rx_addv. The README says they are for experimenting with gt's functions and that the documentation makes extensive use of them.
The practical effect is that every tutorial and reference example you copy runs against one of these tables. When you swap in your own data, column names, types and missing values will differ, so formatting calls such as fmt_date(columns = date, ...) or fmt_number(columns = volume, ...) need their column arguments rewritten. The repository also keeps a data-raw/ folder next to data/, which is where the source for those datasets is kept.
Two ways to install, and the GitHub one needs devtools
The stable version comes from CRAN:
install.packages("gt")The development version comes from GitHub:
devtools::install_github("rstudio/gt")The second line calls devtools by namespace, so devtools must already be installed. The GitHub route gives you whatever is on the master branch, not a tagged release, and the README gives no way to pin to a specific version from there.
The release history is recent: v1.2.0 on 2025-12-16, v1.3.0 on 2026-01-22 and v1.4.0 on 2026-10-15, with the last push to the repository the same day as v1.4.0. If a bug you hit is fixed after that date, only the GitHub route has it until the next CRAN release.
The repository field says NOASSERTION while the README says MIT
The license field detected on the repository reads NOASSERTION. The README, in its License section, says gt is licensed under the MIT license and points to LICENSE.md, with a copyright line naming Posit Software, PBC. The repository root holds both a LICENSE file and a LICENSE.md file, which is the likely reason an automatic scan could not settle on one answer.
For most uses the README statement is what you act on. If you redistribute gt inside a product or a validated clinical environment, read the two license files yourself instead of relying on a badge or a repository label.
Summary statistics and domain tables belong to other packages
gt is a display layer. The README lists packages that use or extend it: gtsummary, gtExtras, pointblank, tfrmt and gto. The first four each have their own GitHub and website links, and gto has a GitHub link only. If you search for gt versus gtsummary, the answer in the README is that they are separate packages and gtsummary is one of those that uses gt to generate tabular output.
The project is primarily maintained by Rich Iannone, and other authors may occasionally help. Questions go to GitHub Discussions, the gt_package Discord server, or the gt-package Bluesky account, and bugs go to the issue tracker. There is also a Test Drive on Posit Cloud, a public project where you can try gt in the browser at no charge.
Editorial conclusion
gt suits R users who want presentation tables built from named parts and rendered to HTML, LaTeX or RTF, and who already have their data in a tibble or data frame. It is the wrong tool if you need a format outside those three, or if you expect it to compute summary statistics for you. Check the reference site for the format you need before you build a report around it.
Frequently asked questions
What does gt() do in R?
gt() takes table data, a tibble or data frame, and creates a gt table object. You then add the table header, formatting and other parts with further functions in the pipeline.
What package is gt in R?
gt is the R package from the rstudio/gt repository for making display tables. It is on CRAN and licensed under MIT according to its README.
How do I install the gt package in R?
Run install.packages("gt") for the CRAN version, or devtools::install_github("rstudio/gt") for the development version from GitHub.
How do I save a gt table in R?
Export it to a file with gtsave(). The README names HTML, LaTeX and RTF as the currently supported output formats.
Official sources
Add this badge to your README
If you maintain this project, the badge below links readers to this analysis and shows its maintenance status from the daily GitHub snapshot. Paste the markdown into your README; add ?metric=license or ?metric=stars to the image URL for a different field.

[](https://hysenlabs.com/projects/rstudio-gt)Star history chart for your README
[](https://hysenlabs.com/projects/rstudio-gt)Was this useful?