Two binaries in one image, a version kept in a Go file, and five tracing propagators compiled in
Go microservice template for Kubernetes
At a glance
- What is it?
- podinfo is a small Go web application built to be deployed on Kubernetes by people learning how to deploy microservices, and every feature in it exists to make somebody else's demo reproducible. The build file is where it gets honest: the version number lives in a source file, the test target deletes the module checksum file before running, and the image declares build arguments it never turns into labels.
- Who is it for?
- podinfo is for demonstrating deployment and progressive delivery rather than for production traffic, and it is better at that than most samples because the failure paths are real: a route that crashes the process on purpose, a fault switch that makes one replica sick while the probes stay green, and a token endpoint that expires in a minute. Two things to know before you lean on it.
- Can I use it commercially?
- Yes. Apache-2.0 is a permissive licence: you can use, modify and sell software built on it, as long as you keep its copyright and licence notices.
- Is it still maintained?
- Yes. The repository last received commits 6 days ago.
- What is it written in?
- Mainly Go, according to GitHub's language statistics.
Answers come from the project's GitHub data, last synced on November 15, 2026, and from our analysis. They are not legal advice.
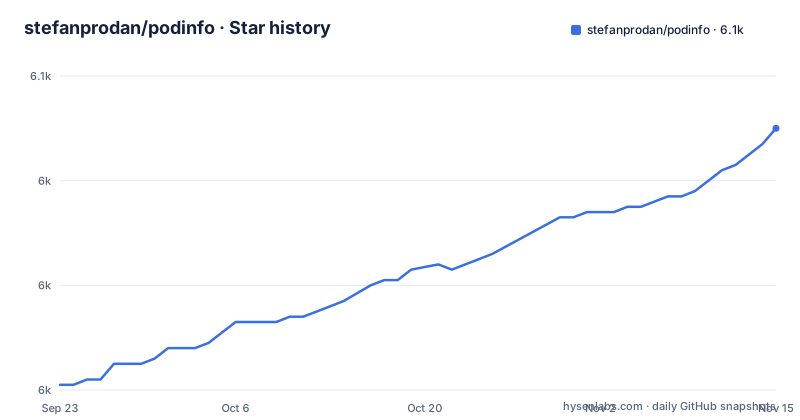
Star history
- stefanprodan/podinfo6,050 ★ · +49
| Repository | 2026-09-23 | 2026-11-15 |
|---|---|---|
| stefanprodan/podinfo | 6k | 6.1k |
49 Stars in the last 53 days, measured from the daily GitHub snapshot. Compare with other projects
Editorial analysis
Two binaries in one image, and three build arguments that produce one label
The container build produces two executables and ships both. The builder stage compiles the application and a separate command line client, each with the same flags: symbols stripped, and the revision string injected into the version package at link time. The runtime stage is a bare Alpine image that installs certificates, a client tool and a network utility, creates an unprivileged user, gives that user the working directory, copies the application in, and puts the client on the system path so it can be run from inside the container. The ui and kustomize directories are copied alongside the binary. What is missing is as interesting as what is there: the runtime stage declares three build arguments for the build date, the version and the revision, and then writes exactly one label, naming the maintainer. So the image knows its version at build time and forgets it in its metadata.
The version lives in a Go file, and the test target deletes go.sum first
The build file says so in a comment: the release version is controlled from the version package. The number is read out of a Go source file by grepping for the version line, passing the result through a field extractor and a character filter, so the release process is text substitution rather than a tag convention. A separate target does the substitution in place with a text editor in batch mode, which is how a release number gets into the file. The same file also derives the commit string by asking the repository to describe itself with a dirty flag, so an uncommitted tree produces a visibly different build. Two details in the test target deserve attention. The test target depends on tidying, formatting and vetting, so running the suite is not a read-only operation. And tidying deletes the module checksum file before regenerating it, pinned to a compatibility level one minor version behind the language version the module declares.
Five context propagators are compiled into the binary
The dependency list is where this project explains itself, because it is organised around the idea of being a demo that works in someone else's environment. The telemetry section includes four separate context propagation formats alongside the OpenTelemetry one: the AWS format, the B3 format used by a common tracing product, the Jaeger format, and the older OpenTracing format. Each is a small library, and none of them is optional in the sense of being absent. The rest of the block is what you would expect from an application instrumented for tracing: the core library, a bridge that turns the structured logger's output into telemetry, instrumentation for the router, for outbound HTTP calls and for request tracing, the software development kit with its trace and log pipelines, and OTLP exporter modules for logs and traces, including gRPC exporters. Pinning all of it means a workshop can point the sample at whichever collector the attendee already runs.
The fault switch keeps the probes green on purpose
One endpoint pair is the most instructive thing in the whole API. Enabling fault injection makes a single instance answer with HTTP 500 to every application endpoint, and the readme is explicit about what stays healthy while that happens: the health probes, the metrics endpoint, the profiling endpoints and the fault control endpoints themselves. That is a deliberate design, and the reason given is that it lets you test a client's circuit breaker or outlier detection against one sick replica in a set of good ones. If the probes failed too, the cluster would simply remove the instance and you would learn nothing. The control surface is three routes, one to enable, one to disable and one that reports which state it is in. There is also a deliberate panic route that crashes the process with a non-zero exit code, and the gRPC surface has the equivalent returning a cancelled status, so both failure modes can be demonstrated from either protocol.
Token, cache, store and chunked routes exist to be called from a shell
The rest of the API is a catalogue of things a test can do to a service. A token route issues a JSON web token valid for one minute, with a one-line example that captures it into a shell variable and a companion route that validates it from an authorization header. Cache routes read and write a key in Redis, which is why the Helm chart has a switch for it. A store route writes the posted body to disk and returns its SHA1, and a matching route reads it back by hash, so you can watch a payload survive a restart. A delay route waits, a chunked route returns a partial response and then waits, and a websocket echo route has a client example using the bundled command line tool. The documentation endpoint is not for humans only: the readme says the swagger document is what Linkerd uses for service profiling and what Gloo uses to discover routes, which is the clearest statement of the project's purpose on the page.
Four installer formats in the tree, four documented routes, one version floor
The repository carries the manifests in four formats, and the readme gives an install command for each. A Timoni module is applied from an OCI reference in a single line:
timoni -n default apply podinfo oci://ghcr.io/stefanprodan/modules/podinfoHelm is offered twice, once from a chart repository and once from the registry as an OCI artifact, and the repository-based example is the interesting one: it installs a frontend pointed at a backend service, runs the chart's own test suite against the frontend, and then installs a backend with the Redis switch turned on, waiting on each install. Kustomize is applied straight from the repository reference, in a line that contains a doubled slash before the directory name. Docker is a plain run command mapping one port. The version floor for all of it is Kubernetes 1.23. The two-releases pattern is worth copying in your own demos, since it is the smallest complete example of two services talking to each other with a real dependency behind one of them.
Two signing key stores for one image, and a ten-minute update interval
The image is signed, and the repository is set up for two different signing systems at once, with a configuration directory for each. The specification list also says a software bill of materials and provenance attestations are embedded in the image rather than published beside it, and that dependency scanning uses a vulnerability checker written for the language. The badges point at the end-to-end workflow, the test workflow, the vulnerability scan workflow, an attestations page and the container registry.
Editorial conclusion
podinfo is for demonstrating deployment and progressive delivery rather than for production traffic, and it is better at that than most samples because the failure paths are real: a route that crashes the process on purpose, a fault switch that makes one replica sick while the probes stay green, and a token endpoint that expires in a minute. Two things to know before you lean on it. The version number is not in the manifest or the tag scheme, it is in a Go source file that the build reads with a text match. And the image is built for both an application and a client tool, with curl and a network utility installed in the runtime layer so the diagnostics work without leaving the container.
Frequently asked questions
what is pod info
Podinfo is a small Go web application built to show how to run a microservice on Kubernetes, with readiness and liveness endpoints, a gRPC surface, Redis-backed cache routes, a panic route, fault injection and Prometheus and OpenTelemetry instrumentation. Flux and Flagger use it for end-to-end testing and workshops.
How do I install podinfo?
Four routes are documented: apply a Timoni module from an OCI reference, install from a Helm chart repository or from the registry as an OCI artifact, apply Kustomize directly from the repository, or run the container image with one port mapped. Kubernetes 1.23 is the stated minimum version.
What does the podinfo fault injection endpoint do?
It makes one instance answer HTTP 500 on every application endpoint while the health probes, the metrics endpoint, the profiling endpoints and the fault control endpoints stay healthy, so you can test a client's circuit breaker against a single sick replica. Separate routes enable it, disable it and report the current state.
How is the podinfo image signed and verified?
The specification list names container image signing with Sigstore cosign, says a software bill of materials and provenance attestations are embedded in the image, and names a vulnerability scanner for dependencies. The repository carries signing configuration for two different tools, and the badge row links an attestations page.
Where does podinfo keep its version number?
In a Go source file inside its version package, not in the module manifest or the tag names. The build file reads the number out of that file with a text match, injects a commit description into the binary at link time, and has a target that rewrites the number in place when you tag a release.
Official sources
Add this badge to your README
If you maintain this project, the badge below links readers to this analysis and shows its maintenance status from the daily GitHub snapshot. Paste the markdown into your README; add ?metric=license or ?metric=stars to the image URL for a different field.

[](https://hysenlabs.com/projects/stefanprodan-podinfo)Star history chart for your README
[](https://hysenlabs.com/projects/stefanprodan-podinfo)Was this useful?