Yappi is a tracing profiler that understands threads, coroutines and greenlets
Yet Another Python Profiler, but this time multithreading, asyncio and gevent aware.
At a glance
- What is it?
- Yappi is yet another Python profiler, but it is a tracing profiler written in C that supports multithreading, asyncio and gevent, and it can report wall time or CPU time per thread and per coroutine. The standard library profilers can give you none of that, which is the reason this one exists.
- Who is it for?
- Adopt Yappi when you are profiling a threaded or asynchronous Python service and the standard library profilers give you nothing useful, because they were designed for a single threaded process and report neither CPU time nor per coroutine figures. Do not adopt it in a hot path: it is a C extension, it has to be compiled for your platform, and the overhead of tracing is not free.
- Can I use it commercially?
- Yes. MIT is a permissive licence: you can use, modify and sell software built on it, as long as you keep its copyright and licence notices.
- Is it still maintained?
- Yes. The repository last received commits 122 days ago.
- What is it written in?
- Mainly Python, according to GitHub's language statistics.
Answers come from the project's GitHub data, last synced on November 7, 2026, and from our analysis. They are not legal advice.
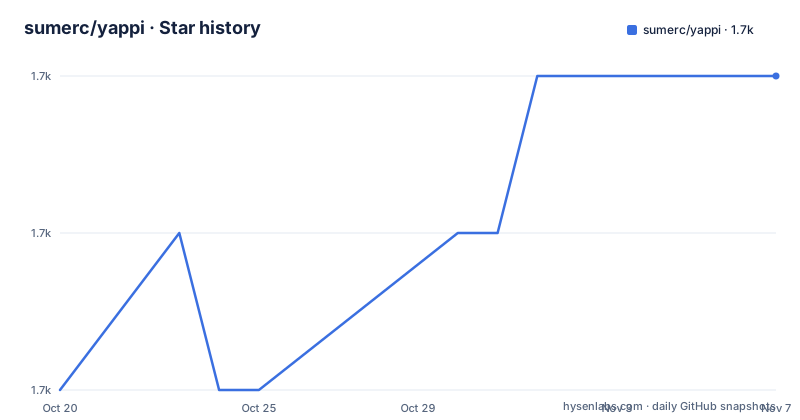
Star history
- sumerc/yappi1,732 ★ · +2
| Repository | 2026-10-20 | 2026-11-07 |
|---|---|---|
| sumerc/yappi | 1.7k | 1.7k |
2 Stars in the last 18 days, measured from the daily GitHub snapshot. Compare with other projects
Editorial analysis
A profiler that traces rather than samples
Yappi is described as a tracing profiler that is multithreading, asyncio and gevent aware, and the name of the repository makes the lineage obvious. Yet Another Python Profiler, but this time multithreading, asyncio and gevent aware.
The implementation detail that matters is in the highlights. It is completely written in C, and the description says lots of love and care went into making it fast. That is not a small detail for a profiler, because a profiler that distorts what it measures is worse than no profiler, and a tracing profiler that records every call pays for itself by not needing statistical inference.
The other highlights are about what you can do with the result. The profiler can be started and stopped and results can be obtained from any time and any thread. Results can be saved in callgrind or pstat formats, so the output goes into tooling you already have rather than into a viewer of its own. And results can show either wall time or actual CPU time, and can be aggregated from different sessions.
That last point is the one worth pausing on. If you profile a service on a machine and again on another, or in a container with a different CPU, the ability to aggregate sessions is what lets you compare them at all.
The implementation language is Python with a C extension, the licence is MIT, the last push was on 2026-07-08, and the recent releases are v1.7.7 from 2026-05-22, v1.7.6 and v1.7.5 both from 2026-03-17. The package is classified as Development Status 5, Production/Stable, with classifiers for Python 3.9 through 3.13.
What the standard library profilers cannot do
The Motivation section is the clearest statement of why a fourth profiler exists.
CPython's standard distribution comes with three deterministic profilers, cProfile, Profile and hotshot. cProfile is a C module based on lsprof, Profile is in pure Python, and hotshot can be seen as a small subset of cProfile. The major issue is that all of these lack support for multi-threaded programs and CPU time.
The consequences are spelled out. To profile a multi-threaded application with them you must give them an entry point and then maybe merge the outputs, and none of them are designed to work on long-running multi-threaded applications. It is also not possible to profile an application that starts, stops and retrieves traces on the fly with them.
That last point is the one that matters for a service. A profiler that can only be attached at startup and that has to be told where the program begins is not usable on a long-running process, and a profiler that cannot measure CPU time is measuring the wrong thing for a program that spends its life waiting on a network.
The second half of the motivation is about asyncio, dated to 2019. With the latest improvements in the asyncio library and asynchronous frameworks, most of the current profilers lack the ability to show correct wall and CPU time or even call count information per coroutine, and that is why a different kind of approach to profiling asynchronous code was needed.
Coroutine profiling and the greenlet story
The answer to the asyncio problem arrived in version 1.2, and the readme describes what it added.
Yappi, with v1.2, introduces the concept of coroutine profiling. With it you should be able to profile the correct wall and CPU time and call count of your coroutine, including the time spent in context switches, too.
The inclusion of context switch time is the detail that distinguishes this from a naive wrapper around the standard profiler. In an event loop, a coroutine that spends most of its life waiting is not doing work, and an accounting that counts the wait as time in the coroutine tells you nothing about where the program is actually busy. Counting the switches separately is what lets you see the difference between a coroutine that computes and a coroutine that waits.
The gevent support is the same idea for a different concurrency model, and there is a separate greenlet profiling document for it, alongside the coroutine profiling one.
And then there is the tagging and filtering mechanism, which the readme calls out as having interesting use cases. The idea is that one profiling session can produce results that are then tagged and filtered in different ways, which is the same problem the per thread filtering solves but generalised.
For a service with a request path, a background worker and a scheduled job in one process, the ability to slice the same trace by context is the feature that makes the numbers actionable.
Start, stop, and read the results whenever you like
The API is small, and the simple example in the readme shows the whole lifecycle.
import yappi

def a():
    for _ in range(10000000):  # do something CPU heavy
        pass

yappi.set_clock_type("cpu") # Use set_clock_type("wall") for wall time
yappi.start()
a()

yappi.get_func_stats().print_all()
yappi.get_thread_stats().print_all()
The clock type is chosen before the run, and the comment points out that wall time is the other option. The results come back through two accessors, the function statistics and the thread statistics, and both print a table with the name, the call count, the total and subtotal time and the average.
The design point is that the profiler is an object you start and stop, not a wrapper you run a function under. That is what makes it usable on a long-running process, and it is what the highlights mean by the profiler can be started and stopped and results can be obtained from any time and any thread.
Installation is the usual pair.
$ pip install yappi$ pip install git+https://github.com/sumerc/yappi#egg=yappiThe second form builds from source, which matters when there is no wheel for your interpreter and platform, and the packaging configuration in the repository skips the free threaded 3.14 build in the wheel builder configuration.
Per thread and per module filtering
The threading example is the one that shows what the profiler adds over the standard library, and it is about one line of the API.
You can profile a multithreaded application via Yappi and can easily retrieve per-thread profile information by filtering on ctx_id with the get_func_stats API.
So the thread statistics give you a list of threads, and each one has an id, and you pass that id to get_func_stats to get the function level numbers for that thread alone. The example joins three threads, stops the profiler and then prints the function stats for each thread in turn, which is the thing you cannot do with cProfile.
The filtering API is more general than threads. You can use filter_callback on the get_func_stats API to filter on functions, modules or whatever is available in the YFuncStat object, and the example filters by module.
stats = yappi.get_func_stats(
    filter_callback=lambda x: yappi.module_matches(x, [current_module])
)  # x is a yappi.YFuncStat object
stats.sort("name", "desc").print_all()
The result object is a pstat style statistics object, so the sort call is the standard one from the profile module, and the various flags defined for filtering and sorting profiler results are what make the output usable rather than merely complete.
The build is a C extension, and the release runs from a Makefile
The repository is small and it is a compiled project, and both facts are visible in the tree.
There is a yappi/ directory with the package, a setup.py that builds the C extension, a doc/ directory for the guides the readme links, a tests/ directory and a run_tests.py, a Misc/ directory, a CHANGELOG, a THANKS.md, a VERSION file, a MANIFEST.in, and a pyproject.toml whose build system is setuptools with a cibuildwheel configuration that skips the free threaded 3.14 wheels.
The setup file shows how careful the C build is. It detects the compiler, and on a POSIX system other than macOS it checks whether the compiler has a timer_create function in the rt library, and if it does it adds the LIB_RT_AVAILABLE macro and links against rt. That is the piece of platform work that makes a wall clock timer available where the system does not provide one by default, and it is the kind of detail that explains why a profiler like this has to be a C extension rather than a pure Python package.
There are two build switches in the same file, _DEBUG, which compiles and links with debugging information and no optimisation, and _PROFILE, which links against the CPU profiler so you can profile yappi with itself.
The Makefile is where the release process lives, and it is unusual enough to be worth reading. The bump-version target refuses to run unless you are on master, it writes the version into the VERSION file, and it then calls an AI tool to write the changelog entry from the git log between the last tag and HEAD, asking for the exact format the existing CHANGELOG uses. The release target then extracts that section of the changelog, shows it, asks for confirmation, and creates the GitHub release.
Editorial conclusion
Adopt Yappi when you are profiling a threaded or asynchronous Python service and the standard library profilers give you nothing useful, because they were designed for a single threaded process and report neither CPU time nor per coroutine figures. Do not adopt it in a hot path: it is a C extension, it has to be compiled for your platform, and the overhead of tracing is not free. Verify first which clock you actually want, since wall time and CPU time tell different stories about a program that waits, and that your interpreter version has a matching wheel rather than requiring a local build.
Frequently asked questions
What is Yappi?
It is a tracing profiler for Python, written in C, that supports multithreading, asyncio and gevent. It can report wall time or CPU time, per thread and per coroutine, and it can be started and stopped so results can be retrieved at any time from any thread.
Why not just use cProfile?
The standard library profilers, cProfile, Profile and hotshot, lack support for multi-threaded programs and CPU time, are not designed for long-running multi-threaded applications, and cannot start, stop and retrieve traces on the fly.
What does coroutine profiling add?
Introduced with version 1.2, it gives the correct wall and CPU time and call count for a coroutine, including the time spent in context switches, which is what separates a coroutine that computes from one that waits.
How do I get per thread results?
Call get_thread_stats to get the list of threads, then pass the thread id as ctx_id to get_func_stats. More generally, get_func_stats accepts a filter_callback that can filter on functions, modules or anything available in the YFuncStat object, and the result sorts with the standard pstat sort call.
What output formats does Yappi support?
Results can be saved in callgrind or pstat formats, so the output can be read with the standard tooling rather than needing a viewer of its own. The highlights also note that results can be aggregated from different sessions.
Does Yappi need to be compiled?
It is a C extension, and the setup file builds it, checking for timer_create in the rt library on POSIX systems other than macOS. You can install the wheel with pip install yappi, or build from source with pip install git+https://github.com/sumerc/yappi#egg=yappi.
Official sources
Add this badge to your README
If you maintain this project, the badge below links readers to this analysis and shows its maintenance status from the daily GitHub snapshot. Paste the markdown into your README; add ?metric=license or ?metric=stars to the image URL for a different field.

[](https://hysenlabs.com/projects/sumerc-yappi)Star history chart for your README
[](https://hysenlabs.com/projects/sumerc-yappi)Was this useful?