tick-rs is a realtime stock ticker that lives entirely in your terminal
Realtime ticker data in your terminal 📈
At a glance
- What is it?
- tick-rs is a Rust terminal application that pulls price data from Yahoo! Finance and draws line, candle and kagi charts with ratatui, with configurable time frames, an update interval and optional pre and post market hours. The API client is a separate crate in the same workspace, and the whole thing installs with cargo, pacman or a Homebrew tap.
- Who is it for?
- Adopt tick-rs when you want to watch a handful of positions from a terminal multiplexer without opening a browser, and you are comfortable with a data source that is a public web API rather than a paid feed. Do not adopt it as a source of truth for trading, since the data comes from Yahoo!
- Can I use it commercially?
- Yes. MIT is a permissive licence: you can use, modify and sell software built on it, as long as you keep its copyright and licence notices.
- Is it still maintained?
- Yes. The repository last received commits 172 days ago.
- What is it written in?
- Mainly Rust, according to GitHub's language statistics.
Answers come from the project's GitHub data, last synced on November 6, 2026, and from our analysis. They are not legal advice.
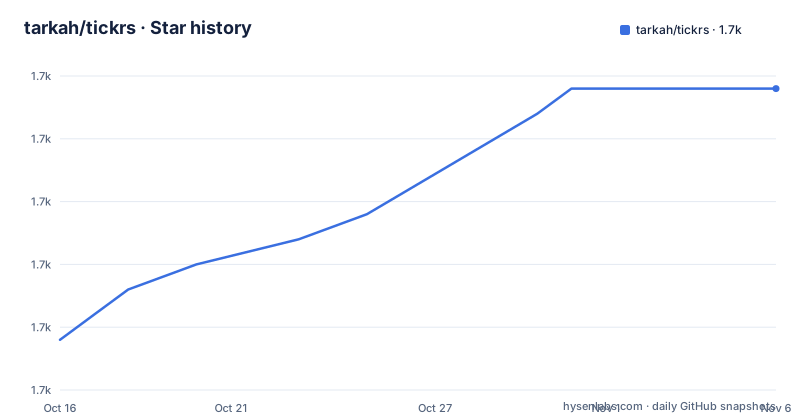
Star history
- tarkah/tickrs1,712 ★ · +10
| Repository | 2026-10-16 | 2026-11-06 |
|---|---|---|
| tarkah/tickrs | 1.7k | 1.7k |
10 Stars in the last 21 days, measured from the daily GitHub snapshot. Compare with other projects
Editorial analysis
A ticker built as a TUI, not a web app
tick-rs is realtime ticker data in your terminal, built with Rust, with the data sourced from Yahoo! Finance.
The distinction from a browser based ticker is the point. There is no server you start, no account and no page to keep open. The application is a single process that draws into your terminal, which means it lives in a multiplexer tab next to your editor, and it disappears when you close the pane.
The rendering is done with ratatui, and the acknowledgements name the library it is built on, tui-rs by fdehau, described as a great TUI library for Rust, along with ytop by cjbassi as the inspiration for the project.
The implementation is Rust with the 2021 edition, the licence is MIT, and the package version is 0.15.0. The last push was on 2026-05-19, and the recent releases are v0.15.0 from 2025-12-15, v0.14.11 from 2025-02-21 and v0.14.10 from 2024-06-17, so the project is on a steady 0.x line with a release roughly every few months.
The Cargo manifest also sets lto to true in the release profile, which is the kind of detail a small terminal application gets right for its own startup time.
Four ways to install it
The Installation section covers the usual routes, and the first is a binary.
Download the latest release for your platform from the GitHub releases page, which is the quickest way to try it and the only one that does not need a Rust toolchain.
With Cargo installed, it is one command.
cargo install tickrsOn Arch Linux it is in the community repository.
pacman -S tickrsAnd on macOS there is a tap.
brew tap tarkah/tickrs
brew install tickrs
The Homebrew route is worth noting for a project of this size, because maintaining a tap is work, and it means a macOS user does not need a Rust toolchain to try the application.
There is also a configuration file, and the readme points at a wiki entry for the format rather than describing it, so the details of that file are a page away rather than in the readme.
The command line, and what the flags actually do
The CLI usage screen is the whole interface, and it is a good one to read because each flag answers a question about how you want the chart to behave.
tickrs [FLAGS] [OPTIONS]

FLAGS:
    -p, --enable-pre-post    Enable pre / post market hours for graphs
    -h, --help               Prints help information
        --hide-help          Hide help icon in top right
        --hide-prev-close    Hide previous close line on 1D chart
        --show-volumes       Show volumes graph
    -x, --show-x-labels      Show x-axis labels
        --summary            Start in summary mode
        --trunc-pre          Truncate pre market graphing to only 30 minutes prior to markets opening
The options are the initial state. The chart type can be line, candle or kagi, with line as the default. The symbols option takes a comma separated list of ticker symbols to start with. The time frame can be 1D, 1W, 1M, 3M, 6M, 1Y or 5Y, defaulting to 1D, and it is used both at startup and when new stocks are added. The update interval is the interval in seconds to update data from the API, and it defaults to 1.
The flags are mostly about removing clutter. Hiding the help icon, hiding the previous close line on the one day chart, hiding the toggle block and hiding the x axis labels are all the same decision applied to different parts of the screen, and the reasoning is that a chart in a corner of a terminal is not the place for decoration.
The pre and post market flags are the ones that change the data rather than the view, and --trunc-pre is a middle ground, showing only thirty minutes before the open rather than the full pre market session.
The API client is its own crate
The Cargo manifest has a workspace with two members, the root package and the api directory, and the root package depends on the api crate by path.
tickrs-api = { path = "api/", version = "0.15.0" }So the data fetching layer is a separate crate, tickrs-api, published under the same version, and the terminal application is the part that draws it. The api/ directory in the repository holds that crate, with its own manifest, and the top level listing shows it alongside src/, assets/ for the demo recording, the Cargo.lock, the Cargo.toml, a rustfmt.toml and a CHANGELOG.md.
That split is the right one for a project like this, because the data client is the part that has to keep up with a web API and the part you might want to reuse. A library that only draws charts is hard to use anywhere else, and a library that only fetches is the part most likely to be replaced.
The workspace also means the two are versioned together, so a tickrs 0.15.0 always pulls a tickrs-api 0.15.0, which removes the class of bug where an API change breaks a specific published build of the client.
The dependency list is a terminal UI stack
The dependency list in the Cargo manifest is short enough to read and it explains the shape of the application.
The rendering side is ratatui at 0.25.0 with the crossterm and serde features, and crossterm itself at 0.25, with a comment in the manifest noting that it is the same version as tui. That comment is the kind of detail that saves an afternoon, because a mismatch between the two versions of a terminal back end produces rendering artefacts that are hard to trace.
The asynchronous core is async-std and futures, with crossbeam-channel for the communication between the data thread and the draw loop, and parking_lot for the locking.
The plumbing is anyhow for error handling, chrono for time, serde with the derive feature and serde_yaml for the configuration file, structopt for the command line parsing, and the rest is supporting cast: better-panic for a readable panic message, lazy_static, itertools, dirs-next for the configuration directory, and rclite.
The use of serde_yaml for the config file is the one that connects back to the wiki page, since a YAML file is what the configuration format is written in, and the manifest is where the dependencies that read it are declared.
Windows needs a terminal that can draw it
There is a short section on Windows in the readme, and it is a single instruction.
Use Windows Terminal to properly display this app.
That is worth taking seriously rather than skipping. A terminal user interface that draws with the alternate screen buffer, moves the cursor to arbitrary positions and reads key presses in raw mode needs a terminal that supports those operations, and the classic Windows console host does not do all of them properly. Windows Terminal does.
It is also the reason the application is a good fit for a terminal multiplexer, since a multiplexer is itself a terminal emulator and therefore a more capable host than the platform default.
The acknowledgements close the readme with the two projects the author credits: tui-rs for the TUI library and ytop for the inspiration. ytop being a terminal system monitor, the influence is in the shape of the interface rather than in the data.
Editorial conclusion
Adopt tick-rs when you want to watch a handful of positions from a terminal multiplexer without opening a browser, and you are comfortable with a data source that is a public web API rather than a paid feed. Do not adopt it as a source of truth for trading, since the data comes from Yahoo! Finance and the update interval defaults to one second. Verify first which chart type and time frame you want, that your terminal supports the rendering it needs, in particular Windows Terminal on Windows, and that you are happy with the default one second polling interval before you leave it running all day.
Frequently asked questions
What is tick-rs?
It is a realtime ticker for the terminal, written in Rust, with the data sourced from Yahoo! Finance. It draws line, candle and kagi charts with ratatui and runs as a single process with no server and no account.
How do I install tick-rs?
Download the latest release binary for your platform, run cargo install tickrs, install it from the Arch community repository with pacman -S tickrs, or tap the project with brew tap tarkah/tickrs and then brew install tickrs.
Which chart types and time frames does tick-rs support?
The chart type option accepts line, candle or kagi with line as the default, and the time frame option accepts 1D, 1W, 1M, 3M, 6M, 1Y or 5Y, defaulting to 1D. The time frame is used at startup and when new symbols are added.
How often does tick-rs fetch data?
The update interval option sets the interval in seconds to update data from the API, and it defaults to 1, so the default is one request per second per run.
Does tick-rs work on Windows?
Yes, but the readme says to use Windows Terminal to properly display the app, since a terminal user interface needs a host that supports the full set of terminal operations.
How is the tick-rs project structured?
As a Cargo workspace with two members, the root package and the api crate at api/, which the root depends on by path at the same version. The chart drawing and the data client are therefore separate crates that are released together.
Official sources
Add this badge to your README
If you maintain this project, the badge below links readers to this analysis and shows its maintenance status from the daily GitHub snapshot. Paste the markdown into your README; add ?metric=license or ?metric=stars to the image URL for a different field.

[](https://hysenlabs.com/projects/tarkah-tickrs)Star history chart for your README
[](https://hysenlabs.com/projects/tarkah-tickrs)Was this useful?