Upptime monitors with a cron run and stores uptime in commits
GitHub Actions uptime monitor & status page by @AnandChowdhary. Upptime** ( is the open-source uptime monitor and status page, powered entirely by GitHub Actions, Issues, and Pages, made with by Anand Chowdhary.
At a glance
- What is it?
- Upptime is an uptime monitor and status page built entirely from GitHub Actions, GitHub Issues and GitHub Pages: a scheduled workflow can ping your endpoints as often as every five minutes, response times are committed to git, downtime becomes issues, and a Svelte status page is built and published. The configuration is one file and the data lives in the repository.
- Who is it for?
- Upptime fits a developer or a small team that already lives in GitHub, wants a status page and an audit trail, and is content for checks to be a scheduled run rather than an always-on probe. It does not fit anything that needs to catch an outage inside the gap between checks, and it does not fit anything whose history must outlive the repository, because the file says plainly that your data is gone if you delete the repo.
- Can I use it commercially?
- Yes. MIT is a permissive licence: you can use, modify and sell software built on it, as long as you keep its copyright and licence notices.
- Is it still maintained?
- Yes. The repository received new commits within the last day.
- What is it written in?
- Mainly Markdown, according to GitHub's language statistics.
Answers come from the project's GitHub data, last synced on November 14, 2026, and from our analysis. They are not legal advice.
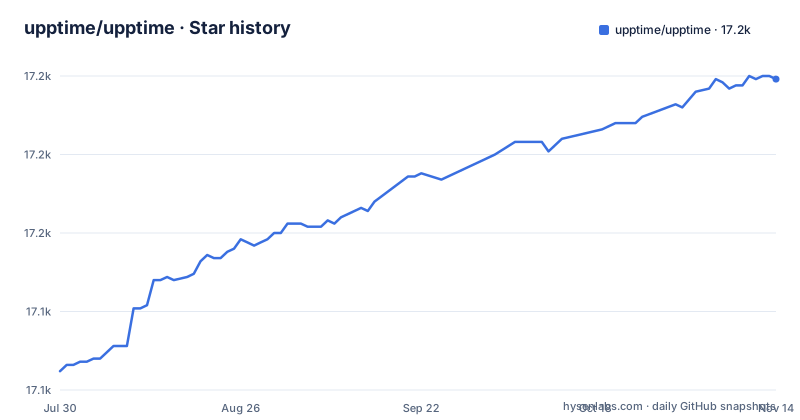
Star history
- upptime/upptime17,199 ★ · +93
| Repository | 2026-07-30 | 2026-11-14 |
|---|---|---|
| upptime/upptime | 17.1k | 17.2k |
93 Stars in the last 107 days, measured from the daily GitHub snapshot. Compare with other projects
Editorial analysis
The check is a scheduled workflow, not a process you host
Everything Upptime does runs on someone else's infrastructure, and the first fact to understand is the schedule. The file says that every five minutes a workflow visits your website to make sure it is up, and elsewhere that checks can run as often as every five minutes. So your monitoring resolution is a cron entry in a workflow file, and the probe is a short-lived runner that starts, makes a request and exits. Two consequences follow that a hosted monitor does not have. An outage that begins and ends between two runs may never be observed, so your uptime percentage is a function of how often you look rather than a measurement of how long you were down. And a run that does not happen, because the platform's runners are busy or a workflow is disabled, is a run that recorded nothing at all, which is not the same as a run that recorded success.
Response times are committed, so the history column is a git log
The mechanism for history is a commit. Response time data is recorded and committed to git, and the file says that is what enables the long-term trend charts and historical insights. You can see it in the generated table in the file: each row has a History cell that links to the commits touching that endpoint's own yaml file under history/, so the audit trail for one endpoint is a path into your repository's log. The advantages are real, since the history is browsable, diffable and attributable to the workflow that wrote it. The costs are equally real. Every check writes to your repository, so the default branch accumulates data at the rate of the schedule multiplied by the number of endpoints, and the retention is whatever your history configuration says. Your uptime data also inherits your repository's access control and your backup schedule, whether you intended that or not.
Downtime becomes an issue, opened and closed by the automation
When downtime is detected, GitHub Issues are automatically opened and closed. That is a better model than a log line, and for once the platform's default features are the right ones: an issue has a timeline, a description, labels, assignment and notifications, and closing it records that the endpoint recovered. The trade-offs sit in the same place. Your issue tracker accumulates one issue per incident, so a noisy endpoint will fill it, and the people who can close those issues are everyone with write access to the repository, which includes a maintainer closing one by hand and the automation closing one on a successful check.
Five workflows, and only one of them is the monitor
The badges at the top of the file name five separate workflows, and their human-readable names give the split away: the uptime workflow, then Response Time CI, then Graphs CI, then Static Site CI, then Summary CI. Only the first one is the monitor. The other four exist to produce the artefacts you read, the graphs, the static site, the summary table. That is why the status page is a Svelte build published to GitHub Pages rather than a live service, because there is nothing serving a request at read time. The practical consequence shows up the first time the page is stale. You may assume the monitor is broken, and go looking at uptime.yml, when the data is fine and the static site or summary workflow is the thing that failed. Knowing the split saves that afternoon.
One configuration file, and deleting the repository deletes the data
The file is direct about the trade: all configuration lives in a single file, and your data is gone if you delete the repo. In the repository that means .upptimerc.yml at the root, with the API for the site, the generated graphs, the per-endpoint history and the assets sitting alongside it. Setup really is one file, there is no server to run and nothing to keep alive, which is the reason the author gives for building it after finding existing services expensive, rigid or closed-source. The same simplicity is the limitation. There is no external database. Portability means cloning the repository, and history means the repository. If the project ends, or you move to a different host, the uptime record goes with it unless you copied the commits somewhere else.
The README's own status table is generated, and it says not to edit it
The file contains a section between generated markers, and the comment inside says the summary is generated by Upptime and that manual changes will be overwritten. Inside it sits a table with a row per endpoint, showing status, a history link, a response time and an uptime percentage, and a similar marker pair wraps the live status line near the top. Two things follow. First, the project's README is its own demonstration, which is why the file is dominated by generated tables rather than prose, and why the demo row for one endpoint appears with a placeholder name instead of a real service, showing the table can carry a masked entry. Second, and more practically, if you fork this to monitor your own services, your README becomes a machine-maintained file. Anything you write between the generated markers will be overwritten.
The releases stopped in 2020 while the branch kept taking commits
The tag list is the awkward part of the project. The releases are v1.13.0 and v1.13.1, both on 2020-08-10, and v2.0.0 on 2020-10-13, and the last push recorded for the repository is 2026-11-02. So the published release line stopped nearly six years ago while the branch kept receiving commits, which means the tag list tells you nothing about how current the code is. If you are evaluating the project, do not read the releases as a maintenance signal in either direction: they are too old to be evidence of abandonment and there are no recent ones to be evidence of activity. The commit history is the only record. Practically, that means adopting it from a tag is adopting 2020 code, and the sensible approach is to fork and run the workflows from the branch, while the file names Canonical and Wakatime as organisations using it.
Editorial conclusion
Upptime fits a developer or a small team that already lives in GitHub, wants a status page and an audit trail, and is content for checks to be a scheduled run rather than an always-on probe. It does not fit anything that needs to catch an outage inside the gap between checks, and it does not fit anything whose history must outlive the repository, because the file says plainly that your data is gone if you delete the repo. Before you adopt it, read .upptimerc.yml and decide the schedule, since the documented default is every five minutes, but GitHub may delay or drop scheduled jobs under high load, so this is not a guaranteed detection time. Then work out which of the five workflows is failing when the page is stale, because the monitor is only one of uptime, response time, graphs, static site and summary. And note that the release line stopped in October 2020 while the branch kept taking commits, so fork from the branch rather than from a tag.
Frequently asked questions
What is Upptime?
It is an open-source uptime monitor and status page powered entirely by GitHub Actions, GitHub Issues and GitHub Pages, made by Anand Chowdhary. A scheduled workflow checks your endpoints, response times are committed to git, downtime opens and closes issues, and a status page built with Svelte is published through Pages.
How does Upptime check endpoints?
GitHub Actions is used as the monitor: a workflow visits each configured endpoint on a schedule, as often as every five minutes, to verify it is online. The response time data from each run is recorded and committed to git, which is what produces the long-term trend charts and the historical data.
Where does Upptime keep its configuration and its data?
All configuration lives in a single file, .upptimerc.yml at the root of the repository, and the generated response time data is committed into the repository under history/. The file also states that your data is gone if you delete the repository, since there is no external database.
Is Upptime a substitute for a hosted status page service?
The project argues the point from the author's own reason for building it: he wanted an uptime monitor that was affordable, flexible and under his control, and found existing services expensive, rigid or closed-source. Upptime is free if you already use GitHub, with no external server or subscription, and it gives a git-native audit trail of changes and events.
Official sources
Add this badge to your README
If you maintain this project, the badge below links readers to this analysis and shows its maintenance status from the daily GitHub snapshot. Paste the markdown into your README; add ?metric=license or ?metric=stars to the image URL for a different field.

[](https://hysenlabs.com/projects/upptime-upptime)Star history chart for your README
[](https://hysenlabs.com/projects/upptime-upptime)Was this useful?