maidr adds braille, sonification and text output to charts you already have
Multimodal Access and Interactive Data Representation
At a glance
- What is it?
- A TypeScript library from the (x)Ability Design Lab that wraps an existing chart in braille, text and sonification output, driven by a JSON schema and reachable from React or a plain HTML file. It also exposes a maintenance wrinkle: the npm package is at 4.11.0 while the cdnjs mirror is still pinned to 3.75.1.
- Who is it for?
- Teams with an existing React, Plotly, D3 or Recharts pipeline and a real obligation to serve blind and low-vision readers can get a working braille, text and sonification layer from a JSON schema and one script tag. People starting from scratch, or anyone bound to jsDelivr being the only reachable host, should read the CDN split first.
- Can I use it commercially?
- Yes, with conditions. GPL-3.0 is a copyleft licence: if you distribute software that includes it, you must release that software's source code under the same licence. Running it internally without distributing it does not trigger that obligation.
- Is it still maintained?
- Yes. The repository received new commits within the last day.
- What is it written in?
- Mainly TypeScript, according to GitHub's language statistics.
Answers come from the project's GitHub data, last synced on October 22, 2026, and from our analysis. They are not legal advice.
Star history
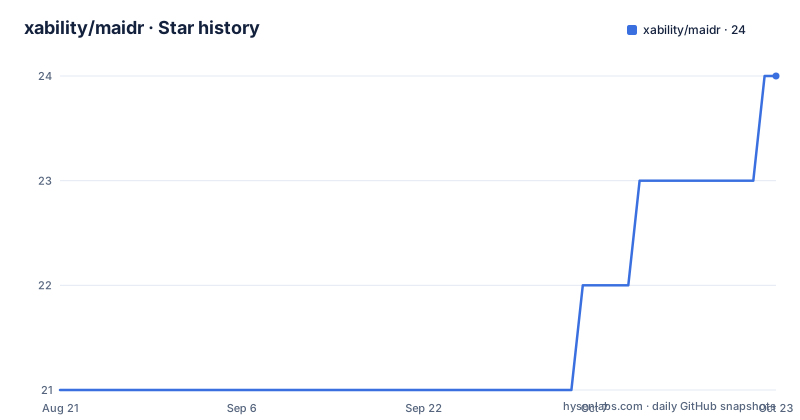
- xability/maidr24 ★ · +3
| Repository | 2026-08-21 | 2026-10-22 |
|---|---|---|
| xability/maidr | 21 | 24 |
3 Stars in the last 62 days, measured from the daily GitHub snapshot. Compare with other projects
Editorial analysis
The JSON schema is the contract, and the SVG is only the highlight layer
Getting a chart into maidr is three steps. Bring in the plot, build an HTML page that loads the script, then describe the same plot in the maidr JSON schema. That last object is what every non-visual mode reads from, so it carries the real payload.
The page itself is deliberately thin. One script tag, no stylesheet link, and an SVG sitting in the body with an ID attribute of your choosing:
<!doctype html>
<html lang="en">
  <head>
    <meta charset="UTF-8" />
    <title>maidr Example</title>
    <script src="https://cdn.jsdelivr.net/npm/maidr@latest/dist/maidr.js"></script>
  </head>
  <body>
    <div>
      <!-- Your SVG plot is here -->
    </div>
  </body>
</html>
Because the interface is styled at runtime and the notation stylesheet is fetched only when mathematical notation turns up, a page missing that link still works.
cdnjs is still serving 3.75.1 while npm is on 4.11.0
Two CDNs host maidr, and they are not in sync. cdnjs has no floating alias, so its URL names a fixed version and stays there until a maintainer moves it:
<script src="https://cdnjs.cloudflare.com/ajax/libs/maidr/3.75.1/maidr.min.js"></script>The library page on cdnjs names the current release; the hardcoded URL above does not follow it.
The split matters in sandboxed pages, where a `script-src` policy allows only a fixed set of hosts. A document that names `cdnjs.cloudflare.com` and nothing else cannot load maidr from jsDelivr no matter how well jsDelivr is performing. What limits this further: `maidr.js` is the only file mirrored on cdnjs. The Plotly guide needs no adapter because Plotly charts are detected on their own, but every other chart library loads a separate adapter bundle such as `d3.js`, `anychart.mjs`, `chartjs.js` or `highcharts.js`, and those bundles are not mirrored, so they come from jsDelivr regardless.
React 18 or 19, one isolated instance per chart on the page
For React applications the npm route installs the package and imports from the `maidr/react` entry point, which ships its own TypeScript types:
npm install maidrimport { Maidr } from 'maidr/react';
import type { MaidrData } from 'maidr/react';
const chartData: MaidrData = {
id: 'my-chart',
title: 'Sales by Quarter',
subplots: [[{
layers: [{
id: '0',
type: 'bar',
axes: { x: 'Quarter', y: 'Revenue' },
data: [
{ x: 'Q1', y: 120 },
{ x: 'Q2', y: 200 },
{ x: 'Q3', y: 150 },
{ x: 'Q4', y: 280 },
],
}],
}]],
};
function App() {
return (
<Maidr data={chartData}>
<svg>{/* Your chart SVG */}</svg>
</Maidr>
);
}Each instance is fully isolated, so several accessible charts can share a page without interfering. React 18 or 19 is required.
Eleven stable trace types, four experimental ones whose shape may still move
The list of plot types is split into tiers, and the tier is a promise about data format rather than about whether the type renders. Stable: bar plot, boxplot, candlestick chart, heatmap, histogram, line plot, pie chart, scatter plot, smooth curve such as a regression line or density curve, step plot, violin plot, and segmented bar plots covering stacked, side by side dodged and normalized stacked arrangements.
Experimental: Sankey diagrams, treemaps, radar charts and waterfall charts. These work, but their data format and navigation can still change between releases. The trace type stability section of the schema documentation carries the full list and states what each tier guarantees, which is the page to read before choosing a type for a chart you plan to ship.
Per plot type, the schema supplies the object properties and data formats that the braille, text and sonification modes consume.
A PNG works, but you give up the visual highlight
maidr is built around scalable vector graphics because visual highlighting needs to point at real elements in the document. Raster images such as PNG and JPG are supported, with the visual highlight feature unavailable on them. Everything else stays available: braille, text, sonification, keyboard navigation, and the interactive and AI-generated plot descriptions.
That split is the practical answer to whether a chart has to be re-rendered as SVG to be made accessible with this library. It does not, but the sighted-navigation layer degrades.
Descriptions can come from OpenAI GPT, Anthropic Claude or Google Gemini. They can also come from a local model through Ollama, which needs no API key and is described as suitable for sensitive data.
The modes themselves are grouped as braille, text, and sonification, abbreviated BTS, and keyboard navigation is the entry point into all three. Adding the ID attribute to the SVG is what makes the visual highlight land on the right element rather than on the whole image, so it is a required step rather than cosmetic. That step can be automated from R, which matters for pipelines that regenerate charts on every run instead of hand writing one page.
The package was rewritten in TypeScript and the old one moved to maidr-legacy
The current npm package is a full TypeScript rewrite done for architecture and performance. The earlier version is archived separately at `xability/maidr-legacy`, so migration is not a version bump. Code written against the old JavaScript package should be read against the archived repository rather than assumed compatible.
The manifest at 4.11.0 is an ES module package with explicit subpath exports: the root resolves to the bundled `dist/maidr.js`, and each supported chart library gets its own entry, including `./react`, `./apexcharts`, `./anychart`, `./d3`, `./google-charts`, `./highcharts`, `./observable` and `./recharts`, plus a wildcard `./locale/*` path. That export map is the concrete difference between a charting library being supported and a separate bundle being needed for it.
Licensing is GPL-3.0-or-later, with the homepage at maidr.ai and the repository at github.com/xability/maidr.
The same engine sits behind py-maidr and the R package
maidr is developed at the (x)Ability Design Lab at the University of Illinois Urbana-Champaign, and the library is described as the engine behind py-maidr for Python and the R version at r.maidr.ai. The same non-visual modes therefore reach R and Python users without those languages reimplementing braille, sonification and text output.
The repository is set up for a library with several release surfaces rather than a single one. Alongside `src/` and `docs/` sit `examples/` with per-library HTML files covering AmCharts, AnyChart and ApexCharts, an `e2e_tests/` directory with Playwright and Jest configuration, a `cdnjs/` directory, typedoc output configuration, husky hooks, commitlint configuration and a `.releaserc.json` for release automation. The CI workflow is referenced in the README badges.
Release cadence is frequent. v4.9.0 shipped 2026-09-21, v4.10.0 on 2026-09-23 and v4.11.0 on 2026-09-28, with the last push on 2026-09-29. The `./locale/*` export in the manifest is the seam behind the language support, and the repository keeps an `_extensions/` directory alongside `media/` for assets. With releases this close together, pinning a version is worth more than following a floating tag, particularly given how far the CDN mirrors lag behind the manifest.
Editorial conclusion
Teams with an existing React, Plotly, D3 or Recharts pipeline and a real obligation to serve blind and low-vision readers can get a working braille, text and sonification layer from a JSON schema and one script tag. People starting from scratch, or anyone bound to jsDelivr being the only reachable host, should read the CDN split first. Two things are worth checking before you commit: the experimental trace types may still change shape between releases, and the rewritten TypeScript package is not a drop-in match for the archived JavaScript version in maidr-legacy. If the data cannot leave your network, the Ollama path exists precisely for that case.
Frequently asked questions
Does maidr require my chart to be rendered as SVG?
No. Raster formats such as PNG and JPG are supported, but the visual highlight feature is only available for scalable vector graphics. Braille, text, sonification and keyboard navigation remain available either way.
Which React versions does the maidr React component support?
React 18 or 19 is required. The component is imported from the `maidr/react` entry point as `Maidr`, with the data object typed as `MaidrData`, and each instance is fully isolated so multiple charts can sit on one page.
Which plot types in maidr are still experimental?
Sankey diagrams, treemaps, radar charts and waterfall charts are experimental: they work, but their data format and navigation may still change between releases. The stable types include bar, boxplot, candlestick, heatmap, histogram, line, pie, scatter, smooth curve, step, violin and segmented bar plots.
Can maidr generate chart descriptions without sending data to an external API?
Yes. Alongside OpenAI GPT, Anthropic Claude and Google Gemini, descriptions can be generated by a local model running through Ollama, which requires no API key and is intended for sensitive data.
Why would I load maidr from cdnjs instead of jsDelivr?
Sandboxed embedding contexts usually allow only a fixed set of CDN hosts, so a page whose script-src policy names cdnjs.cloudflare.com cannot reach jsDelivr at all. The cdnjs URL names a fixed version, currently 3.75.1, and only maidr.js is mirrored there; per chart library adapter bundles still load from jsDelivr.
Official sources
Add this badge to your README
If you maintain this project, the badge below links readers to this analysis and shows its maintenance status from the daily GitHub snapshot. Paste the markdown into your README; add ?metric=license or ?metric=stars to the image URL for a different field.

[](https://hysenlabs.com/projects/xability-maidr)Star history chart for your README
[](https://hysenlabs.com/projects/xability-maidr)