zop.dev helm-charts: datastores with values you are allowed to change
charts used for kubernetes deployment
At a glance
- What is it?
- The zop.dev Helm repository publishes charts for eighteen datastores and a set of applications, and the interesting mechanism is not the chart list but the values schema, which marks the fields a user is allowed to override, plus a metadata annotation that registers each chart in the zop.dev catalogue automatically.
- Who is it for?
- Adopt these charts if you are deploying a supported datastore on Kubernetes and want a working default configuration, and you are happy to take the defaults that the chart author chose for storage, replication and resources. Do not adopt them as a starting point for a production datastore you intend to tune, because the values schema deliberately exposes only the fields marked mutable.
- Can I use it commercially?
- Yes. Apache-2.0 is a permissive licence: you can use, modify and sell software built on it, as long as you keep its copyright and licence notices.
- Is it still maintained?
- Yes. The repository last received commits 4 days ago.
- What is it written in?
- Mainly Go Template, according to GitHub's language statistics.
Answers come from the project's GitHub data, last synced on November 7, 2026, and from our analysis. They are not legal advice.
Star history
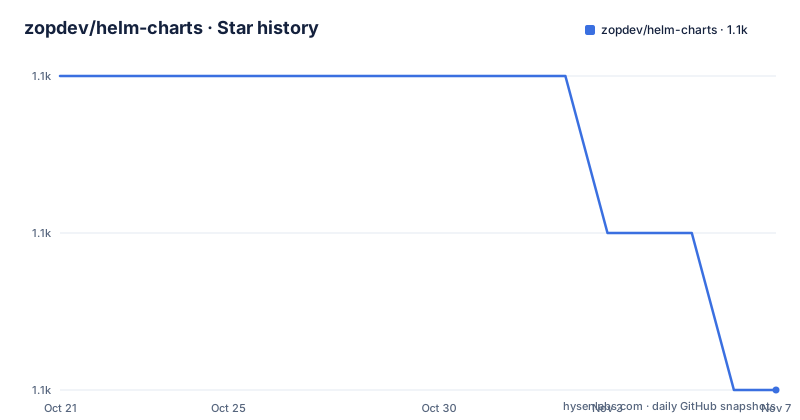
- zopdev/helm-charts1,059 ★ · -2
| Repository | 2026-10-21 | 2026-11-07 |
|---|---|---|
| zopdev/helm-charts | 1.1k | 1.1k |
-2 Stars in the last 17 days, measured from the daily GitHub snapshot. Compare with other projects
Editorial analysis
A Helm repository with a catalogue behind it
The zop.dev Helm Charts repository is described as an extensive collection of charts for datastores and applications, designed to simplify the deployment and management of popular datastores on Kubernetes. The stated goal is to streamline operations and integrate with the zop.dev ecosystem.
That last clause is the key to the design. These are not independent charts published by the community. They are the deployment half of a hosted platform, and the charts carry metadata so that the platform knows about them.
The repository is Apache-2.0 licensed, with a contributing guide and a code of conduct, and the last push was on 2026-10-14. The primary language is recorded as Go Template, which is the templating language the charts themselves are written in.
The repository layout is small and says what the project is. There is a `charts/` directory with the charts themselves, a `charts-lint/` directory, a `docs/` directory, `images/`, a `promql/` directory, and a `CNAME` file at the root, which is the file that binds the GitHub Pages site to the hostname `helm.zop.dev`. That is why every chart in the README links to `https://helm.zop.dev/src/readme.html?id=...` rather than to a path in the repository: the documentation is generated and served from the chart repository itself.
The release names are worth a glance, because they are unusual. The three most recent releases are `scale-to-zero-image-v0.0.1` from 2026-08-07, `db-init-image-v0.0.1` from 2026-05-06 and `opentsdb-image-v0.0.1` from 2026-03-05. These are container images published alongside the charts, versioned separately, and named after the chart they support.
Two commands, and a documented set of overrides
The prerequisites are Helm and access to a running Kubernetes cluster. Installation is the standard two-step Helm flow, adding the repository and installing a chart from it:
helm repo add zop https://helm.zop.dev
helm install <release-name> zop/<chartname>
The examples section repeats it with a concrete name, installing the `service` chart as `my-app`:
helm repo add zop https://helm.zop.dev
helm install my-app zop/service
The remaining examples are the ordinary lifecycle commands, and it is worth noting that the upgrade example uses `--set` for a value rather than a values file:
helm upgrade my-app zop/service --set ingress.enabled=trueThe uninstall and list commands are `helm uninstall my-app` and `helm list`.
The claim in the key features is that charts deploy with default values and that no manual configuration is needed to get started. For a datastore that is a real decision rather than a convenience, because the persistence, the storage class, the credentials and the resource requests all have to come from somewhere, and in these charts they come from the chart author's defaults.
The chart list in the README is a good indicator of coverage. The datastores include MySQL, PostgreSQL, MariaDB, Redis, SurrealDB, Dgraph, Solr, OpenTSDB, ChromaDB, Cassandra, CockroachDB, ClickHouse, Kafka, a distributed Redis variant, SolrCloud, ScyllaDB, Qdrant and MongoDB, and a column marks which of them expose metrics. The applications include HeyForm, HolmesGPT, JupyterHub, LibreDB Studio, LiteLLM and LocalAI, each with a deploy button that goes through the platform's own deployment flow.
The values schema marks what you may change
The second key feature is the interesting one. Users can override selected parameters through a dedicated `values.yaml` with a corresponding `values.schema.json` that marks user-modifiable fields with `"mutable": true`.
So the override mechanism is not the usual one. In a normal chart, everything in `values.yaml` is overridable and the schema exists to validate the shape of what you supply. Here the schema is also a permission list, and a field without the mutable marker is not something a user is expected to change.
The reason is visible in the chart documentation pages, which are generated per chart and served from `helm.zop.dev/src/readme.html?id=...`. The id in the query string selects a chart, and the page is presumably built from the chart's schema, so the set of fields shown as editable is the set the chart author decided to expose.
That is a defensible design for charts whose defaults are known to work, and it is a poor fit for a chart whose defaults need adjusting for a particular cluster. The conventional Helm workflow, where you copy `values.yaml`, change what you need and pass it with `-f`, assumes a wide surface of overridable fields. Here the surface is deliberately narrow.
The overriding command is the standard one, with a values file:
helm install my-app zop/service -f values.yamlSo the question for a user is not how to override a value, but which values are exposed, and the answer is per chart and documented in the schema.
Every chart registers itself with the platform
The third key feature is that every chart includes a required metadata annotation, either `type: datasource` or `type: application`, which ensures automatic reflection in the zop.dev Applications and Datasources section.
That single annotation is what makes these charts part of a product rather than a collection. The platform reads the metadata from the chart, reflects the chart in its own catalogue, and the user sees the datastore listed with a deploy button that leads into the platform's deployment flow, as the README's application table shows with its links to `zop.dev/zopday/app/deploy?install=...`.
The consequence is that the charts are the integration point. A chart that does not carry the annotation is not listed, and a chart that carries it is expected to behave in the way the platform assumes when it deploys one: the defaults, the storage, the exposed ports and the service discovery all have to match what the platform expects, which is why the values that would change that behaviour are the ones held back behind the mutable marker.
It also explains the two application tables in the README. The datastores are listed with a metrics column, marking the charts that expose metrics so the platform can scrape them, and the applications are listed with a deploy button rather than a metrics column, because the platform deploys them differently.
The releases named after images rather than charts, `scale-to-zero-image`, `db-init-image` and `opentsdb-image`, are consistent with this: they are the supporting containers the platform needs for specific charts, and they are versioned and released on their own.
Where these charts are the wrong tool
The first wrong case is a datastore you need to tune. The charts are built to work with defaults, and the values schema deliberately exposes only the fields marked mutable. A production MySQL or Kafka deployment usually needs the storage class, the replica count, the memory and CPU requests, the backup configuration and the authentication set deliberately, and if those are not in the mutable set, the chart is not the right level of control.
The second wrong case is a requirement to own the chart source. These charts are served from `helm.zop.dev`, the vendor's own repository, generated from this repository and published as a Helm repository with a CNAME binding. If your organisation requires charts to come from an internal registry, or requires the chart source to be vendored into your own repository so that a change in the upstream cannot alter a production deployment, this model does not fit.
The third is a datastore the list does not cover. The catalogue is substantial, but a chart for a specific engine, a specific operator or a specific SaaS connector is not there, and a chart that runs a database you already operate through its own operator is redundant.
The fourth is an environment where the platform itself is not in play. The metadata annotation exists to make the charts appear in the zop.dev catalogue, and the deploy buttons go through the platform's own deployment flow. If you are deploying with plain Helm and not through zop.dev, the annotation is inert metadata and the charts are simply a set of defaults with a restricted override surface.
The last is a long-lived installation. A chart whose defaults are the point, released from a repository the vendor controls, is a reasonable choice for a quick and a poor one for an installation that has to be reproducible in three years, because the values you could not change are the values that will not be reviewed by you.
Editorial conclusion
Adopt these charts if you are deploying a supported datastore on Kubernetes and want a working default configuration, and you are happy to take the defaults that the chart author chose for storage, replication and resources. Do not adopt them as a starting point for a production datastore you intend to tune, because the values schema deliberately exposes only the fields marked mutable. Before you install, read the chart's documentation page for the values you are allowed to change, check that your cluster has the storage class the chart expects, and note that the repository lives at helm.zop.dev, so the charts are served by the vendor rather than from a public Helm repository you control.
Frequently asked questions
How do I install a chart from the zop.dev Helm repository?
Add the repository with `helm repo add zop https://helm.zop.dev`, then install a chart from it, for example `helm install my-app zop/service`. The README also documents upgrading with `helm upgrade my-app zop/service --set ingress.enabled=true` and uninstalling with `helm uninstall my-app`.
Which values can I override in a zop.dev chart?
Only the selected ones. Each chart has a `values.schema.json` that marks user-modifiable fields with `"mutable": true`, and you supply them in a `values.yaml` passed to helm install with `-f`.
Which datastores have charts in the zop.dev repository?
The list includes MySQL, PostgreSQL, MariaDB, Redis, SurrealDB, Dgraph, Solr, OpenTSDB, ChromaDB, Cassandra, CockroachDB, ClickHouse, Kafka, a distributed Redis chart, SolrCloud, ScyllaDB, Qdrant and MongoDB, and the README marks which of them expose metrics.
What is the metadata annotation on each chart for?
Every chart carries a required annotation of `type: datasource` or `type: application`, which ensures automatic reflection in the zop.dev Applications and Datasources section of the platform.
Official sources
Add this badge to your README
If you maintain this project, the badge below links readers to this analysis and shows its maintenance status from the daily GitHub snapshot. Paste the markdown into your README; add ?metric=license or ?metric=stars to the image URL for a different field.

[](https://hysenlabs.com/projects/zopdev-helm-charts)Star history chart for your README
[](https://hysenlabs.com/projects/zopdev-helm-charts)Was this useful?