anvaka/sayit for exploring related subreddits as a graph
Visualization of related subreddits
At a glance
- What is it?
- anvaka/sayit is a Vue-based visualization of related subreddits derived from shared commenters and Jaccard Similarity. It is best treated as a fixed historical exploration tool, not a live recommendation service.
- Who is it for?
- Adopt anvaka/sayit for exploring the included subreddit relationship data and reading its Vue implementation, not for current community recommendations or an active data pipeline. Do not choose it if you need live Reddit data, an explanation for every automated edge, or a maintained release process.
- Can I use it commercially?
- Yes. MIT is a permissive licence: you can use, modify and sell software built on it, as long as you keep its copyright and licence notices.
- Is it still maintained?
- Activity is slowing. The repository last received commits 7 months ago.
- What is it written in?
- Mainly JavaScript, according to GitHub's language statistics.
Answers come from the project's GitHub data, last synced on November 6, 2026, and from our analysis. They are not legal advice.
Star history
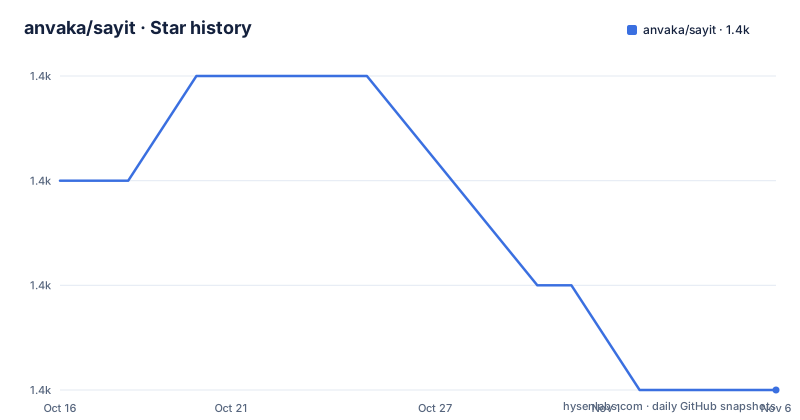
- anvaka/sayit1,433 ★ · -2
| Repository | 2026-10-16 | 2026-11-06 |
|---|---|---|
| anvaka/sayit | 1.4k | 1.4k |
-2 Stars in the last 21 days, measured from the daily GitHub snapshot. Compare with other projects
Editorial analysis
What Sayit's subreddit graph represents
anvaka/sayit addresses a specific discovery problem: showing how subreddits relate when their users have participated in overlapping comment discussions. Its README describes the recommendation rule as Redditors who commented in one subreddit also having commented in another. That makes the project useful for people who want to move from a known community to adjacent subjects, browse association paths, or inspect the shape of a historical Reddit network.
The source is not a current Reddit export. The README says the graph was computed from two months of comments, August and September 2018, representing approximately 38 million `user <-> subreddit` records. The generated results were stored separately in the `anvaka/sayit-data` repository and served through the GitHub Pages application. Consequently, the graph describes overlap in that historical sample, not present membership, current activity, moderation policy, or the complete set of topics associated with a community.
Sayit is therefore a visualization of prepared relationship data rather than a general-purpose Reddit client. The README directs users to the hosted demo and offers a local application for development. It does not describe authenticated Reddit API access, live crawling, a public query API, or a workflow for replacing the old dataset.
How Jaccard Similarity builds the relationship layer
The documented computation uses Jaccard Similarity between subreddits. In this model, overlapping Reddit users provide the sets being compared, and the resulting score determines which subreddit relationships enter the prepared dataset. The exact data-processing implementation is not documented in the README. Based on the repository layout, generation-related work appears under `scripts/`, while the computed results are held in the separate `sayit-data` repository and should not be treated as confirmed implementation details.
The algorithm has a documented weakness for large communities. The author reports that very popular subreddits produced unhelpful similarities: communities such as `/r/aww`, `/r/pics`, and `/r/funny` became connected because their user sets overlapped too broadly. This is an important interpretation boundary. A high similarity score can indicate broad cross-posting or participation by the same large population without identifying a close topical relationship.
Sayit also contains manual overrides. For popular subreddits, the author collected references from subreddit descriptions where available. When a description offered no recommendation, frequently mentioned subreddits in comments were selected manually. Those overrides are documented in the `sayit-data` repository. As a result, the displayed network combines two different kinds of evidence: computed Jaccard Similarity for ordinary relationships and editorial relationships for cases where the statistic did not distinguish communities well.
That mixture affects interpretation. A graph edge should not automatically be read as a current endorsement, an official affiliation, or a statement that one community duplicates another. The interface may present neighboring nodes compactly, but the underlying evidence varies by edge.
The Vue client and graph libraries in the manifest
The application is a JavaScript project built around Vue 2. `package.json` identifies the package as `sayit-ui`, declares `vue` as `^2.6.11`, and includes `vue-template-compiler` with the same compatible major version. The development toolchain comes from `@vue/cli-service` `~4.5.0`, with Babel, ESLint, PostCSS, Stylus, and Vue-specific loaders.
The dependency list shows that the browser application is designed around a graph interface rather than a conventional list of related communities. It includes `ngraph.graph` for graph data structures, `ngraph.forcelayout` for force-directed positioning, `ngraph.kruskal` for spanning-tree operations, `ngraph.events` for event handling, and `ngraph.random`. Rendering and navigation support comes from `simplesvg` and `panzoom`. `delaunator` can support spatial partitioning for visualization interactions. Search and URL-state behavior are represented by `fuse.js`, `fuzzysort`, and `query-state`.
These dependencies establish the client-side building blocks, but the README does not document the exact component hierarchy, viewport behavior, ranking rules, keyboard controls, or accessibility implementation. It also does not state whether the complete graph is loaded at once or split into requests. The homepage and `public/`, `src/`, and `scripts/` directories are the appropriate files to inspect for those answers.
The stack is old enough to warrant compatibility checks. Vue 2.6 and Vue CLI 4 are explicit dependencies. The package does not use the current Vue 3 generation, and the repository has no GitHub releases that define a supported upgrade path.
Running the hosted demo and building the local client
The quickest documented use is the GitHub Pages demo at `https://anvaka.github.io/sayit/`. It exposes the prepared visualization without requiring a local JavaScript build. A reader should expect a graph centered on subreddit relationships, with navigation intended for examining nearby communities.
For local development, install the dependencies from the repository root. The README specifies the following command:
npm installThe command uses the checked-in `package-lock.json`, although the README does not explicitly require `npm ci`. Do not substitute a start command from generic Vue documentation. In this repository, `package.json` defines `start` and `build`, while the README's older Local Build Setup section refers to `npm run dev`. The documented `npm run dev` command does not match the scripts currently declared in `package.json`.
Start the Vue CLI development server with the script that the manifest actually defines:
npm run startVue CLI will print the served address. The README states `localhost:8080` for its development setup, but `vue.config.js` contents are not available here to confirm whether that port is fixed or overridden. Do not assume the command starts successfully merely because the older instructions mention it.
Create the production bundle with:
npm run buildThe script invokes `vue-cli-service build`. The README describes minification for the production build, which is standard behavior described for this setup, but the generated directory name is not documented in the README or package manifest. The README also mentions `npm run build --report`; npm argument forwarding should be checked against the installed npm and Vue CLI versions, since the manifest declares only the `build` script and no separate report script.
Static exploration versus live Reddit recommendations
Sayit's main strength is that it turns a large relationship dataset into a navigable visual form. It gives a reader access to connections that may not be obvious from subreddit names alone, and the graph format can reveal clusters and paths between communities. This makes the client more informative than a flat list when the goal is visual browsing.
A live recommendation system is a different kind of project. Such a system would need current comments, an account for deleted content and access limits, a regularly updated dataset, and operational rules for handling changes in Reddit's data access. None of those responsibilities is documented for Sayit. The application is paired with prepared results from a 2018 sample, and the README does not describe a current extraction command or deployment process for replacing it.
Another alternative is a subreddit-search or topic-discovery application. Those tools generally begin from a query and return ranked communities. Sayit instead begins with an already computed network and emphasizes visual exploration. Its advantage is the graph context. Its limitation is that users cannot assume the absence of an edge means the communities have no relationship, because sampling, the similarity threshold, and manual overrides all affect the stored result. The README does not disclose the final threshold or every processing decision, so the visualization should not be treated as a complete map.
Maintenance, licensing, and upgrade implications
The repository is not archived, but its last push was on 2026-04-11. That date records the latest push but does not establish a release cadence. There are no GitHub releases, so users cannot rely on tagged upgrades, release notes, or a stated support policy from this repository. The maintenance cost falls mainly on anyone who wants to rebuild the data pipeline, update dependencies, or deploy a fresh graph.
The main upgrade concern is the legacy web stack. Vue 2, `vue-template-compiler`, Vue CLI 4, and older graph and utility packages require compatibility review. Moving the interface to Vue 3 would not be a routine package installation. It would require checking component APIs, build tooling, event and slot conventions, and any code that relies on Vue 2 behavior. The README does not document such a migration.
The data pipeline carries a separate maintenance burden. Refreshing it would mean obtaining suitable Reddit comment data, rerunning the similarity computation, reviewing changes to popular-subreddit overrides, and republishing the consumed data. The README identifies the source discussion and `sayit-data` repository but gives no current BigQuery job, extraction command, refresh schedule, or operational script.
The project uses the MIT license. That identifier permits use and modification under its terms, but this review does not interpret the license text or provide legal advice. The separate data repository should also be reviewed for its own licensing and attribution details before redistribution.
Interpretation limits when reading popular-subreddit edges
The clearest failure mode is over-trusting an edge around a popular community. Jaccard Similarity performed poorly when broad communities shared many commenters, so the author introduced manual relationships. This improves the presentation for known cases, but it introduces editorial judgment into a graph that otherwise appears mathematical.
There is a second failure mode: confusing data age with current relevance. A relationship derived from August and September 2018 may reflect communities, language, moderation practices, and participation patterns that have since changed. The hosted interface can remain available while its underlying recommendations age. The README offers no freshness indicator, update timestamp, or live-data warning, so provenance has to come from reading its data section.
Sayit is also the wrong tool when a user needs evidence behind a specific recommendation. It does not document user-level explanations such as which individual commenters connect two nodes. The available evidence is aggregate similarity plus documented manual overrides. For research requiring reproducible membership intersections, account-level auditability, or updated data, the visualization alone is insufficient.
These limits do not prevent historical analysis. They define it. Sayit works well as a compact interface for a curated, dated snapshot, provided users understand which edges are computed and which were selected by the author.
Editorial conclusion
Adopt anvaka/sayit for exploring the included subreddit relationship data and reading its Vue implementation, not for current community recommendations or an active data pipeline. Do not choose it if you need live Reddit data, an explanation for every automated edge, or a maintained release process. Verify the contents and age of the bundled data first, then check whether npm run start builds successfully with the repository's pinned Vue 2 toolchain.
Frequently asked questions
How does anvaka/sayit determine related subreddits?
It computes Jaccard Similarity from a historical set of user and subreddit participation records. For popular subreddits where that method produced broad or unhelpful connections, the author also created manual overrides from descriptions and frequently mentioned communities.
How do I run the anvaka/sayit UI locally?
Run `npm install`, then use `npm run start`, which invokes `vue-cli-service serve` according to `package.json`. The README's older `npm run dev` instruction does not match the currently declared package scripts.
Does anvaka/sayit use current Reddit data?
No current-data workflow is documented. Its relationship results were computed from Reddit comments collected in August and September 2018 and stored in the separate `anvaka/sayit-data` repository.
Official sources
Add this badge to your README
If you maintain this project, the badge below links readers to this analysis and shows its maintenance status from the daily GitHub snapshot. Paste the markdown into your README; add ?metric=license or ?metric=stars to the image URL for a different field.

[](https://hysenlabs.com/projects/anvaka-sayit)Star history chart for your README
[](https://hysenlabs.com/projects/anvaka-sayit)Was this useful?