ApexCharts: SVG JavaScript charts with SSR, a plugin API and a licence that is free for most users
📊 Interactive JavaScript Charts built on SVG
At a glance
- What is it?
- ApexCharts renders interactive charts as SVG in any framework, ships full TypeScript types and no runtime dependencies. Version 6 added canvas rendering for dense series and a plugin platform, the README lists SSR support, and it describes the library as free for most users.
- Who is it for?
- Adopt ApexCharts if you need many chart types behind one config object, want real SVG output on the server for Next.js or Nuxt, or plan to ship a dashboard that users zoom, annotate and filter. Do not adopt it if your licence review cannot accept its terms, or if you need a charting engine whose internals you can rewrite, since the rendering code sits behind a stable plugin API rather than being yours.
- Can I use it commercially?
- Check first. The repository uses a licence we do not classify automatically, so read its LICENSE file before any commercial use.
- Is it still maintained?
- Yes. The repository last received commits 1 day ago.
- What is it written in?
- Mainly JavaScript, according to GitHub's language statistics.
Answers come from the project's GitHub data, last synced on November 13, 2026, and from our analysis. They are not legal advice.
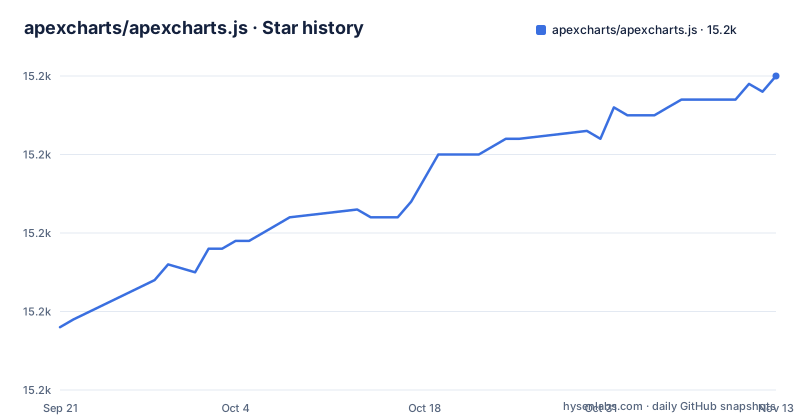
Star history
- apexcharts/apexcharts.js15,190 ★ · +32
| Repository | 2026-09-21 | 2026-11-13 |
|---|---|---|
| apexcharts/apexcharts.js | 15.2k | 15.2k |
32 Stars in the last 53 days, measured from the daily GitHub snapshot. Compare with other projects
Editorial analysis
The problem ApexCharts solves, and who it is aimed at
Most JavaScript charting starts with a framework decision that you later regret. A chart library tied to React means a Vue dashboard needs a second library, and a server-rendered page either ships a blank container or a screenshot. ApexCharts takes the opposite route: the chart is a class you instantiate against a DOM element, with a plain options object, and the package declares zero runtime dependencies. No React, no Vue, no D3 underneath. The README frames the audience directly: dashboards, SaaS and data-heavy UIs.
The feature list is aimed at that audience rather than at scientific plotting. The README states 18+ chart types out of the box, including line, area, bar, column, pie, donut, radar, heatmap, treemap, candlestick, boxplot, funnel, pyramid and gauge in the default bundle, with unit and violin charts one import away. TypeScript definitions ship inside the package, so there is no separate @types install. The repository's samples directory carries vanilla-js, react, vue, requirejs and tree-shaking examples, which tells you the maintainers expect the library to be consumed from several build setups at once.
Where it is the wrong tool is equally clear from that list. If you need WebGL-scale scatter plots with millions of live points, or geographic maps, or a grammar-of-graphics API where you compose marks and scales by hand, this is not that library. The canvas renderer added in v6 raises the ceiling for dense series, but the axes, tooltips, annotations and exports remain SVG, so the ceiling is not unlimited.
How ApexCharts renders: SVG by default, canvas above a threshold
The core mechanism is a chart instance that owns a DOM node and draws SVG into it. You construct it with a selector and an options object, then call render. The options object carries chart type, series, axes, and everything else. According to the README, existing configs keep working unchanged across the v6 transition, which matters if you are upgrading a dashboard rather than starting one.
The v6 notes describe a hybrid renderer. Setting `chart: { renderer: 'auto' }` paints the series layer to canvas once a point threshold is crossed, while axes, tooltips, annotations and exports stay SVG. That is a deliberate split: the parts users interact with keep their DOM nodes and accessibility hooks, and only the dense drawing surface moves to canvas. The trade-off is that the two layers must stay in sync, and anything that assumes SVG elements for the series itself will not see them.
Around that core sit the features that distinguish v6 from earlier releases. `ApexCharts.registerPlugin(def)` registers a plugin, activated per chart with `plugins: [{ name }]`. `chart: { history: { enabled: true } }` records zooms, series toggles, option changes and annotation edits, with `chart.history` exposing undo, redo, jump and transactions. `chart.perspectives.capture()` serializes the view (zoom window, hidden series, selections, annotations, theme) into a token you can place in a URL. `ApexCharts.crossfilter` links charts into a shared filter engine. `chart.streaming` bounds memory for long-running feeds. These are opt-in and, per the README, tree-shakeable.
Installing ApexCharts and rendering a first chart
The README gives two installation paths. The npm package is the one to use if you have a bundler and want tree-shaking, because the package.json export map exposes per-type entry points such as `apexcharts/line`, `apexcharts/area`, `apexcharts/scatter` and `apexcharts/bubble`, plus `apexcharts/ssr` and `apexcharts/client`. Importing from a subpath rather than the root is what keeps the bundle down.
npm install apexchartsWith the package installed, the README's quick start is a bar chart built from a single series and a category axis. The constructor takes a DOM element and the options object; `render()` is what actually draws.
import ApexCharts from 'apexcharts'

const chart = new ApexCharts(document.querySelector('#chart'), {
  chart: { type: 'bar' },
  series: [{ name: 'Sales', data: [30, 40, 35, 50, 49, 60, 70, 91, 125] }],
  xaxis: { categories: [1991, 1992, 1993, 1994, 1995, 1996, 1997, 1998, 1999] }
})

chart.render()
After that runs you should see a bar chart inside the element matching `#chart`, with the nine years on the x axis.
The CDN route avoids a build step entirely. The README shows jsDelivr and cdnjs script tags pinned to a release, loading dist/apexcharts.min.js, the file the `jsdelivr` field in package.json references.
<script src="https://cdn.jsdelivr.net/npm/[email protected]/dist/apexcharts.min.js"></script>For server rendering, package.json declares `ssr` and `client` subpaths. The README says SSR support covers Next.js, Nuxt, SvelteKit, Astro and other meta-frameworks, rendering real SVG on the server and hydrating on the client. Check the framework-specific setup in the online docs.
Where ApexCharts gets in the way
The licence is the first constraint, and it is not a footnote. The README describes ApexCharts as free for most users and points to its License section for the terms. The repository's LICENSE file is the authoritative text, and the GitHub API reports the licence as NOASSERTION, meaning the platform's classifier could not map it to a standard identifier. If your organisation runs automated licence scanning, expect that scan to flag the package and require a human read. Only the licence text tells you whether your use qualifies as free.
Second, the tree-shaking story depends on you. The README claims typical bundles are 30-60% smaller than the full build when you import only what you need, but that only happens if you import from subpaths like `apexcharts/line` instead of the root. A default import from `apexcharts` in an application that uses one chart type will not get that reduction on its own.
Third, the plugin and custom-series APIs are versioned surfaces. `ApexCharts.registerPlugin`, `ApexCharts.registerSeriesType`, `ApexCharts.registerTheme` and `ApexCharts.registerEasing` let you extend the library without forking it, which is the right design, but it also means your custom renderer inherits whatever the library decides to pass it. If you need to change how axes are laid out or how the SVG tree is assembled, the plugin API is not a substitute for owning the renderer.
Finally, the release cadence visible in the repository is fast: v8.5.0, v8.6.0 and v8.7.0 all landed within a week of each other in late October 2026, and the last push to the default branch was on 2026-11-02. Fast releases are good for fixes and bad for anyone who pins loosely and upgrades on a whim. Pin a version and read the release notes before moving.
ApexCharts vs Chart.js: two different answers to the same question
Chart.js is the comparison people search for, and the difference is architectural rather than cosmetic. Chart.js renders to a canvas element by default. That makes it fast for dense data and simple to reason about, but the output is pixels: there is no SVG DOM to inspect, style with CSS, or serialize on the server without extra work. ApexCharts renders SVG by default, which is why the README can promise server-rendered SVG for meta-frameworks and why CSS custom properties such as `--apx-*` can drive chart theming. If your design system already speaks CSS variables, that is a real difference in integration cost.
The second difference is the extension model. ApexCharts exposes a plugin platform, custom series types, custom easing and named themes as registration functions, so an extension is published to npm against a versioned API rather than patched into the library. Chart.js has its own plugin and controller system, and the two are not interchangeable, so a plugin written for one does not transfer.
The third is breadth versus depth. ApexCharts ships candlestick, boxplot, violin, treemap, funnel and unit charts in the same package. If your dashboard is mostly line and bar charts and you want the smallest possible surface, a canvas-first library is a defensible choice. If you need SVG output, server rendering, or the annotation and crossfilter features described in the v6 notes, ApexCharts is the one that ships them without a second dependency.
Upgrade cost, licence exposure and what the repository actually shows
The last push to the default branch was on 2026-11-02, and the most recent release in the repository is v8.7.0 from 2026-10-31. The repository is not archived. That combination means you are adopting something that moves, and your upgrade cost is the cost of tracking it. The README states that existing configs keep working unchanged through the v6 transition, which lowers the cost of a major upgrade. It also recommends pinning CDN URLs to a release, since the unversioned URL serves the next major too.
On licence, the honest position is that this review cannot tell you whether your use is free. The README says it is free for most users, points to a licence section, and the platform classifier returns NOASSERTION. Those three facts together mean the licence is unusual enough that no automated tool will clear it for you. Read LICENSE in the repository, and if you are distributing the library inside a commercial product, get the terms read by someone qualified to read them. That is not legal advice; it is the observation that the package metadata will not answer the question for you.
On the engineering side, the repository layout is conventional for a library of this size: `src/` for source, `dist/` for builds, `types/` for the shipped declarations, `samples/` for framework examples, and both `vite.config.mjs` and `vitest.config.mjs` at the root. The presence of `tsconfig.types-test.json` suggests the type definitions are themselves tested, which is a small but real signal for TypeScript consumers.
Editorial conclusion
Adopt ApexCharts if you need many chart types behind one config object, want real SVG output on the server for Next.js or Nuxt, or plan to ship a dashboard that users zoom, annotate and filter. Do not adopt it if your licence review cannot accept its terms, or if you need a charting engine whose internals you can rewrite, since the rendering code sits behind a stable plugin API rather than being yours. Before you commit, read the LICENSE file in the repository rather than the badge, confirm whether your use falls under the free-for-most-users terms, and check that the subpath exports you plan to import (apexcharts/line, apexcharts/ssr) exist in the installed version, because the package.json export map is what tree-shaking depends on.
Frequently asked questions
Is ApexCharts free to use?
The README describes ApexCharts as free for most users and points to its License section for the terms, and the repository's licence is reported as NOASSERTION. Whether your use is free depends on the text of the LICENSE file in the repository, which is the only authoritative source here.
How do I use ApexCharts in React?
The package has zero runtime dependencies and works in any framework, and the repository includes a samples/react directory alongside samples/vanilla-js and samples/vue. The samples/react directory is the working example to copy.
How do I install ApexCharts from npm?
The README gives the install command as npm install apexcharts, after which you import the default export and construct a chart against a DOM element with an options object containing chart type, series and xaxis categories. The package also exposes per-type subpaths such as apexcharts/line and apexcharts/ssr through its export map.
Can ApexCharts render charts on the server?
Yes. The README states SSR support for Next.js, Nuxt, SvelteKit, Astro and other meta-frameworks, rendering real SVG on the server and hydrating on the client, and package.json declares an ssr subpath.
Does ApexCharts need a separate TypeScript types package?
No. The README states that full type definitions ship with the package and that no @types/* install is needed, and package.json points its typings field at types/apexcharts.d.ts.
Official sources
Add this badge to your README
If you maintain this project, the badge below links readers to this analysis and shows its maintenance status from the daily GitHub snapshot. Paste the markdown into your README; add ?metric=license or ?metric=stars to the image URL for a different field.

[](https://hysenlabs.com/projects/apexcharts-apexcharts-js)Star history chart for your README
[](https://hysenlabs.com/projects/apexcharts-apexcharts-js)Was this useful?