Tetragon: eBPF Security Observability with Kubernetes-Aware Runtime Enforcement
eBPF-based Security Observability and Runtime Enforcement. Cilium’s new Tetragon component enables powerful real-time, eBPF-based Security Observability and Runtime Enforcement.
At a glance
- What is it?
- Tetragon is Cilium's eBPF-based security observability and runtime enforcement component, designed for Kubernetes environments. It detects process execution, syscalls, and file or network I/O, and reacts to security-significant events with Kubernetes identity context.
- Who is it for?
- Adopt Tetragon if you run Kubernetes and need deep, kernel-level security observability with native pod and namespace context, and if you want to enforce policies directly in the kernel via eBPF. Do not adopt it if you need a purely userspace agent or if your workloads run on non-Linux platforms.
- Can I use it commercially?
- Yes. Apache-2.0 is a permissive licence: you can use, modify and sell software built on it, as long as you keep its copyright and licence notices.
- Is it still maintained?
- Yes. The repository last received commits 1 day ago.
- What is it written in?
- Mainly C, according to GitHub's language statistics.
Answers come from the project's GitHub data, last synced on November 14, 2026, and from our analysis. They are not legal advice.
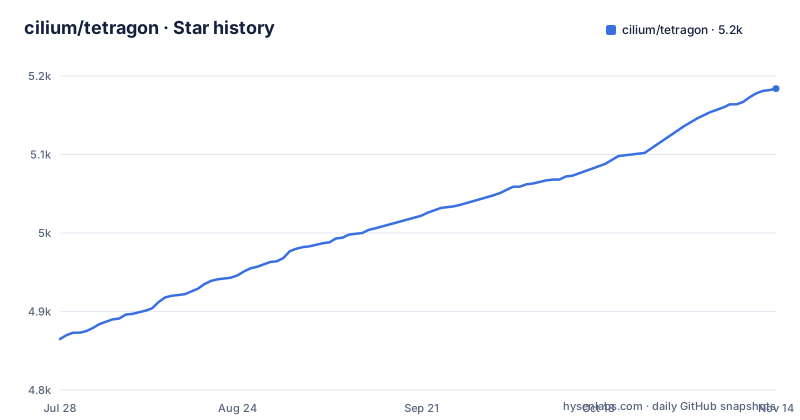
Star history
- cilium/tetragon5,184 ★ · +319
| Repository | 2026-07-28 | 2026-11-14 |
|---|---|---|
| cilium/tetragon | 4.9k | 5.2k |
319 Stars in the last 109 days, measured from the daily GitHub snapshot. Compare with other projects
Editorial analysis
The Problem Tetragon Solves: Kernel-Level Events with Kubernetes Context
Most security tools either work in userspace, which misses low-level kernel activity, or they generate raw kernel events that are hard to correlate with workloads. Tetragon sits in the kernel via eBPF and enriches events with Kubernetes metadata. This means you can answer questions like: which pod executed this binary, or which namespace accessed that file. The README lists process execution, system call activity, and I/O including network and file access as the core event types. This is for platform teams and security engineers who need real-time visibility into workload behavior without losing the container and pod identity.
How Tetragon Works: Sensors, eBPF, and Kubernetes Awareness
Tetragon uses eBPF hooks in the kernel, which it calls sensors, to observe critical events. The README describes two main event categories. First, process lifecycle events: process_exec and process_exit are generated by default, giving full process lifecycle observability. Second, generic tracing: process_kprobe, process_tracepoint, and process_uprobe events cover custom use cases like network observability, filename access, credentials monitoring, and privileged execution. The key mechanism is that events are not just kernel traces; they are enriched with Linux and Kubernetes metadata. This is a differentiator: the eBPF programs run in the kernel, but Tetragon understands Kubernetes identities such as namespaces and pods.
Getting Tetragon Running: Kubernetes, Docker, and the Tetra CLI
The README points to official docs for getting started, with four specific paths. You can try Tetragon on Kubernetes, on Linux via Docker, deploy it in a cluster, or install the Tetra CLI. The exact commands are not in the README. The getting started guides are the authoritative source; the README gives no quick-start command, so the first verification step is to follow those guides.
TracingPolicy: The Core Configuration Mechanism
Tetragon's advanced use cases depend on TracingPolicy, which is a Kubernetes custom resource. The README links to a TracingPolicy concept page, indicating that this is how you define custom kprobe, tracepoint, or uprobe events. For example, to monitor filename access or credentials, you write a TracingPolicy that specifies which hooks to attach and what to filter. This is a powerful model because it allows declarative configuration of kernel tracing, but it also introduces complexity. You need to understand eBPF concepts and the kernel hooks you are targeting. The default process_exec and process_exit events require no policy, so you get basic lifecycle visibility out of the box. For custom events, policies can be managed as Kubernetes resources or loaded outside Kubernetes using the tetra CLI or startup flags. Writing appropriate policies still requires familiarity with the target hooks and filters.
A Genuine Limitation: eBPF Dependencies and Kernel Compatibility
Tetragon's reliance on eBPF is both its strength and its constraint. eBPF programs require a Linux kernel with BPF support enabled, and specific features like kprobes and tracepoints must be available. On older kernels or hardened environments, Tetragon may not function or may require additional privileges. The README does not specify minimum kernel versions, but this is a known consideration for any eBPF tool. Also, because Tetragon runs in the kernel, any bug in the eBPF programs could affect system stability. For non-Linux systems, Tetragon is not an option. If you need to monitor Windows containers or run in a managed environment that restricts eBPF, this is the wrong tool. You should verify your kernel's capabilities before committing.
Alternative: Falco and Its Userspace Approach
A common alternative to Tetragon is Falco, which also does runtime security monitoring but takes a different approach. Falco uses eBPF or kernel modules to collect syscalls, but it ships with a rich set of default rules and a userspace engine that evaluates events against those rules. Tetragon, by contrast, is more tightly integrated with Kubernetes and requires you to define TracingPolicies for custom events. Falco's rule language is a separate DSL, while Tetragon uses Kubernetes CRDs. If you want a drop-in detection tool with minimal configuration, Falco may be easier. If you want fine-grained kernel tracing with pod context, Tetragon is more direct.
Maintenance and License Considerations
Tetragon is licensed under Apache-2.0, which is permissive for commercial use and modification. The project is actively maintained, with v1.8.0 released recently and a regular release cadence (v1.7.1 in August, v1.7.0 in April). This suggests a healthy development cycle. However, the README does not detail upgrade procedures or migration costs. The project has a contribution guide and a USERS.md file listing adopters. You should plan to test upgrades in a staging cluster, especially when moving between minor versions, as TracingPolicy APIs may change.
Who Should Adopt Tetragon and What to Verify First
Tetragon is a strong fit for Kubernetes-native security teams that need real-time process and I/O observability with pod-level context. It is also suitable for organizations already using Cilium, given the shared lineage. Teams without eBPF expertise may find the TracingPolicy learning curve steep. Before adoption, verify that your kernel supports the required eBPF features, that your cluster can run privileged DaemonSets, and that you have a way to manage TracingPolicy CRDs. Test the default process lifecycle events first, then experiment with a simple TracingPolicy for file access. The README does not provide a quick-start command, so rely on the official getting started guides. If you need a solution for non-Linux or heavily restricted environments, look elsewhere.
Editorial conclusion
Adopt Tetragon if you run Kubernetes and need deep, kernel-level security observability with native pod and namespace context, and if you want to enforce policies directly in the kernel via eBPF. Do not adopt it if you need a purely userspace agent or if your workloads run on non-Linux platforms. Before deploying, verify that your kernel supports the required eBPF features and that your security team can manage TracingPolicy CRDs. Test with the getting started guides on a non-production cluster first.
Frequently asked questions
How does tetragon work?
Sensors observe critical hooks in the kernel and Tetragon generates events enriched with Linux and Kubernetes metadata. Process lifecycle events process_exec and process_exit are produced by default, and generic tracing adds process_kprobe, process_tracepoint and process_uprobe events. In Kubernetes it understands namespaces and pods, so detection can be configured against individual workloads.
how to install tetragon
The documentation splits the job into four paths: try Tetragon on Kubernetes, try Tetragon on Linux, deploy Tetragon, and install the Tetra CLI. The readme carries no install command itself and links to each of those guides.
is tetragon open source
Yes. The project is Apache-2.0 licensed, its source lives at github.com/cilium/tetragon, and the readme links to the Apache-2.0 license text alongside BSD 2-Clause and GPL 2.0 license pages.
tetragon vs cilium
Tetragon is a component of Cilium rather than an unrelated project, described as Cilium's Tetragon component for eBPF based security observability and runtime enforcement. It is built as its own Go module, github.com/cilium/tetragon, with bpf/, api/, operator/ and pkg/ directories inside the same tree.
Official sources
Add this badge to your README
If you maintain this project, the badge below links readers to this analysis and shows its maintenance status from the daily GitHub snapshot. Paste the markdown into your README; add ?metric=license or ?metric=stars to the image URL for a different field.

[](https://hysenlabs.com/projects/cilium-tetragon)Star history chart for your README
[](https://hysenlabs.com/projects/cilium-tetragon)Was this useful?