stackprinter: Python tracebacks that show the variable values around the crash
Debugging-friendly exceptions for Python
At a glance
- What is it?
- stackprinter rewrites the standard Python exception message so each frame shows more source lines and the current values of the variables in them, and it can print to stderr, return a string or plug into the logging module. It suits batch jobs and services whose only debugger is a log file, and it is a formatter rather than an error monitoring system.
- Who is it for?
- Adopt stackprinter if your Python code runs where you cannot attach a debugger, such as a scheduled job, a container or a service that only emits logs, because it answers the three questions a traceback normally leaves open, where the crash was, what the nearby variables held, and why the call was made with those arguments.
- Can I use it commercially?
- Yes. MIT is a permissive licence: you can use, modify and sell software built on it, as long as you keep its copyright and licence notices.
- Is it still maintained?
- Yes. The repository last received commits 3 days ago.
- What is it written in?
- Mainly Python, according to GitHub's language statistics.
Answers come from the project's GitHub data, last synced on November 6, 2026, and from our analysis. They are not legal advice.
Star history
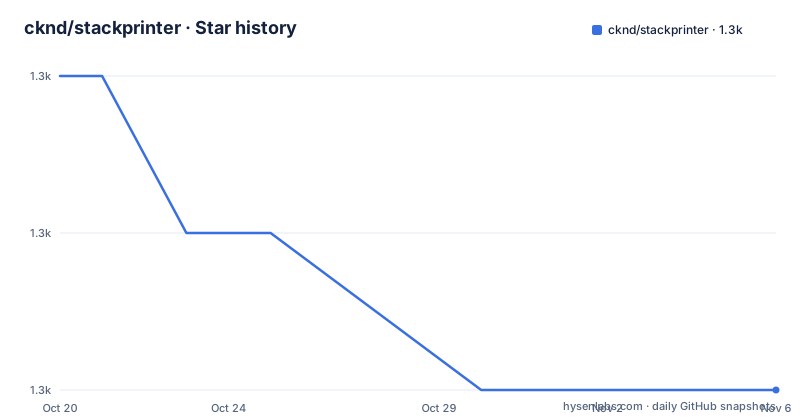
- cknd/stackprinter1,298 ★ · -2
| Repository | 2026-10-20 | 2026-11-06 |
|---|---|---|
| cknd/stackprinter | 1.3k | 1.3k |
-2 Stars in the last 17 days, measured from the daily GitHub snapshot. Compare with other projects
Editorial analysis
What the extra traceback actually shows
The stock Python exception message tells you a file, a line, a function and a type of error. stackprinter adds two things to each frame: more of the surrounding source, and the current values of the variables that appear in those lines.
The documented before and after makes the difference concrete. The standard output for a failed list concatenation is a short chain of frames ending in a TypeError about adding an int and a str. The extended output shows the source around the failing line with an arrow marking the line that raised, a separator, and then the values, so the reader sees that somelist was a list of lists while anotherlist held a list with a string in it, and that spam was a numpy array.
That is the whole argument of the project, stated in the README as answering the questions one would ask an interactive debugger: where in the code was the crash, what is in the relevant variables, and why was that function called with those arguments.
The author is also honest about when it is not the right tool. The README says it is rarely used locally instead of a real debugger, but that it helps when the code runs somewhere where the only debugging tool is a log file, and it adds the parenthesis that it is not a fully grown error monitoring system, with a link to Sentry.
The package installs with pip and the licence is MIT.
pip3 install stackprinterOption one: replace the crash printout once
The simplest integration is a single call, placed once anywhere in your program. After it runs, every uncaught exception is printed with the extended traceback, to stderr by default, exactly where the interpreter would have printed it.
import stackprinter
stackprinter.set_excepthook(style='darkbg2')  # for jupyter notebooks try style='lightbg'
The style argument is the switch between the plain text output, which is what you want in a log file, and the colour output. The comment in the example is a practical note rather than decoration, because a Jupyter notebook has a light background and the dark background style would be hard to read there.
The documentation also mentions making it permanent for a Python installation, which is the sitecustomize or environment approach rather than a code change. That is the version for a shared environment where you want the same output everywhere, and it has the obvious consequence that every script run under that interpreter gets the same format, including scripts you did not write.
Option two: call it inside an except block
The selective path is for code that catches its own exceptions. Inside an except block you have two functions, and the difference between them is where the output goes.
try:
    something()
except:
    # print the current exception to stderr:
    stackprinter.show()

    # ...or instead, get a string for logging:
    logger.error(stackprinter.format())
show() prints to stderr. format() returns a string, which you can hand to your own logger or attach to other context before it goes anywhere.
The exception can also be passed explicitly, which is what you want when you are handling a specific error type and want a readable traceback for it rather than for whatever happened to be in flight.
try:
    something()
except RuntimeError as exc:
    tb = stackprinter.format(exc)
    logger.error('The front fell off.\n' + tb)
This is the mode that fits an application with its own error handling, where the exception is caught and turned into a response, and where a stack trace is usually thrown away or reduced to a type name.
Option three: keep ordinary logger calls and still get annotated tracebacks
The third integration is the one that requires a little plumbing, and it is the most useful for existing codebases, because it means you do not have to touch the call sites.
You write a logging.Formatter subclass whose formatException method delegates to stackprinter, and the example in the README is a class called VerboseExceptionFormatter. The method takes the exc_info tuple, calls stackprinter.format() on it, splits the result into lines, and prefixes each line with a vertical bar so the traceback stays visually attached to the log record rather than floating below it.
import logging
import stackprinter

class VerboseExceptionFormatter(logging.Formatter):
    def formatException(self, exc_info):
        msg = stackprinter.format(exc_info)
        lines = msg.split('\n')
        lines_indented = ["  ┆ " + line + "\n" for line in lines]
        msg_indented = "".join(lines_indented)
        return msg_indented
With that formatter installed on the logger, ordinary code keeps working exactly as before.
logger = logging.getLogger()
try:
    nothing = {}
    dangerous_function(nothing.get("something"))
except:
    logger.exception('My hovercraft is full of eels.')
The log record then carries the annotated traceback, with the arrow-marked source line and the variable values, indented under the message line.
The repository carries a file named demo_logging_hack.py alongside demo_logging.py, which suggests the author tried more than one way of wiring this into logging and kept the experiments.
The options that decide what gets printed
format(), show() and set_excepthook() accept a common set of keyword arguments, and the documentation points to the docstring of format() for the full list. Four of them matter in practice.
suppressed_vars takes regular expressions matched against variable names, and the example hides anything matching .*secret.*. This is the option to set first if the code near a failure point holds credentials, tokens or personal data, because the default behaviour is to print the values it finds. suppressed_paths works the same way for file paths, skipping variables in calls within certain files, with the example matching lib/python.*/site-packages/boringstuff so that library internals stay out of the report.
truncate_vals controls how long a printed value is, with 9001 in the example, against a default of roughly 500 characters per variable. The defaults are deliberately restrained, and the documentation is explicit about the philosophy behind them: by default it tries to be somewhat polite about screen space, showing only a few source lines and the function header, and only the variables that appear in those lines.
try:
    something()
except RuntimeError as exc:
    stackprinter.show(exc, suppressed_vars=[r".*secret.*"],
                           suppressed_paths=[r"lib/python.*/site-packages/boringstuff"],
                           truncate_vals=9001,
                           style="darkbg2")
The style argument accepts the colour schemes, with a light background option for notebooks and dark background options for terminals. The default output is plain text, which the documentation calls out as good for log files.
Colour mode tracks variables, not syntax
The colour mode is the feature the README is slightly apologetic about, describing it as existing for some reason. It offers a few different colour schemes for light and dark backgrounds, and the important detail is what the colours mean.
The colours track different variables rather than the language syntax. So the two variables in a frame are given different colours, and a variable keeps its colour as it appears in different frames of the same traceback. That is a different goal from what most syntax highlighters do, where colour means what the code is, and the README links an article on making semantic highlighting useful for the reasoning.
For a traceback, the reasoning works. If a variable is blue in the frame where the crash happened and blue again two frames up, you can see at a glance that the same value travelled through the call, which is exactly the question the format is trying to answer, namely why that function was called with those arguments.
The images in the repository, darkbg.png, notebook.png and trace.png, show the plain dark background style, the notebook rendering and the traceback form respectively, and the demo scripts in the root directory cover the cases you would want to check before enabling colour, among them demo_chained_exceptions.py, demo_exceptiongroups.py, demo_keyboard_interrupt.py, demo_thread_stack.py and demo_pprint.py.
Maintenance state, and what this library is not
The project is small and stable rather than fast moving. The version in setup.py is 0.2.13, the last push to the repository was on 2026-04-17, and the two releases before that are 0.2.12 from 2024-03-13 and 0.2.11 from 2023-11-24. The declared Python floor is 3.4, and the classifiers list Python 3 and the MIT licence.
So the reasonable expectation is a library whose API is settled rather than one that is gaining features. The changelog and the CHANGELOG.md file at the root are where to look for what changed.
The second point is scope. stackprinter is a formatter, and it says so itself by contrasting itself with a fully grown error monitoring system. It does not aggregate, it does not report anywhere, it does not group errors by fingerprint, and it does not tell you that a crash happened while you were asleep. What it does is render one exception with more context, either to stderr or into a string you pass to a logger that does something else with it.
That limitation is what makes it safe to bolt onto an existing logging setup without changing how errors are handled. It is also why the project points to a separate error monitoring system for that other job.
Editorial conclusion
Adopt stackprinter if your Python code runs where you cannot attach a debugger, such as a scheduled job, a container or a service that only emits logs, because it answers the three questions a traceback normally leaves open, where the crash was, what the nearby variables held, and why the call was made with those arguments. Do not adopt it as an error monitoring system, since the project itself points to Sentry for that, and it is a formatter that renders one exception rather than a collector. Before you wire it into a logger, set suppressed_vars for anything sensitive, because by default the library prints the values of the variables it finds near the failing line.
Frequently asked questions
How do I install and enable stackprinter?
Install it with pip3 install stackprinter, then call stackprinter.set_excepthook(style='darkbg2') once in your program, or use style='lightbg' in Jupyter notebooks. After that every uncaught exception is printed with the extended traceback to stderr.
How do I get a stackprinter traceback as a string for my logger?
Call stackprinter.format() inside an except block, or pass the exception explicitly with stackprinter.format(exc) and log the returned string yourself. The show() function is the equivalent that prints to stderr instead of returning a string.
How do I keep sensitive values out of stackprinter output?
Pass suppressed_vars with regular expressions matching the names you want hidden, for example suppressed_vars=[r".*secret.*"], and suppressed_paths to skip variables in calls within certain files. truncate_vals controls how much of each value is printed.
Can stackprinter work with the standard logging module without changing my logger calls?
Yes. The README shows a logging.Formatter subclass whose formatException method calls stackprinter.format(exc_info) and indents each line, which lets existing logger.exception calls produce annotated tracebacks.
Official sources
Add this badge to your README
If you maintain this project, the badge below links readers to this analysis and shows its maintenance status from the daily GitHub snapshot. Paste the markdown into your README; add ?metric=license or ?metric=stars to the image URL for a different field.

[](https://hysenlabs.com/projects/cknd-stackprinter)Star history chart for your README
[](https://hysenlabs.com/projects/cknd-stackprinter)Was this useful?