fg-data-profiling: one-line EDA for Pandas and Spark, and the rename you have to handle first
1 Line of code data quality profiling & exploratory data analysis for Pandas and Spark DataFrames.
At a glance
- What is it?
- fg-data-profiling is the renamed ydata-profiling package: a one-line exploratory data analysis and data quality profiler for Pandas and Spark DataFrames, exporting HTML, JSON and notebook widgets. The migration step is the part most teams will get wrong.
- Who is it for?
- Adopt fg-data-profiling if you need a shareable profiling artifact from a Pandas or Spark DataFrame and you are willing to run the rename migration now. Do not adopt it if you need a stable package name across a long-lived codebase, or if you expect the HTML report to be your data quality gate rather than a starting point.
- Can I use it commercially?
- Yes. MIT is a permissive licence: you can use, modify and sell software built on it, as long as you keep its copyright and licence notices.
- Is it still maintained?
- Yes. The repository last received commits 11 days ago.
- What is it written in?
- Mainly Python, according to GitHub's language statistics.
Answers come from the project's GitHub data, last synced on November 13, 2026, and from our analysis. They are not legal advice.
Star history
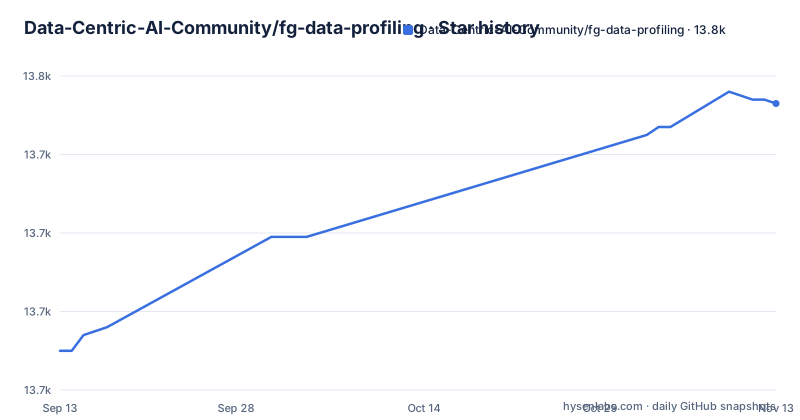
- Data-Centric-AI-Community/fg-data-profiling13,753 ★ · +63
| Repository | 2026-09-13 | 2026-11-13 |
|---|---|---|
| Data-Centric-AI-Community/fg-data-profiling | 13.7k | 13.8k |
63 Stars in the last 61 days, measured from the daily GitHub snapshot. Compare with other projects
Editorial analysis
The problem it solves, and the rename that comes with it
The README frames the goal plainly: a one-line exploratory data analysis experience, positioned as an extension of pandas df.describe(). The intended user is someone who has a DataFrame and needs a first pass over it without writing a per-column analysis by hand. The output is a digested analysis of a dataset, and the README notes it covers time-series and text as well as ordinary tabular columns. That audience is broad: data scientists starting a project, analysts handed an unfamiliar extract, and engineers who need to attach a data quality artifact to a pipeline run.
The rename is not a footnote. The README states that ydata-profiling is now fg-data-profiling, that the old package will no longer receive updates or bug fixes, and that users should follow the migration guide as soon as possible. That means the package name on PyPI, the distribution you install, and the import path have all moved. Anyone evaluating this project is evaluating a package whose identity changed, and the practical consequence is that a requirements file pinning the old distribution will keep resolving to something that is no longer maintained.
What ProfileReport actually produces
The entry point is a single class. The README example builds a DataFrame with numpy and pandas, imports ProfileReport from data_profiling, and calls ProfileReport(df, title="Profiling Report"). Note the import path: the distribution is fg-data-profiling, but the module is data_profiling. That mismatch is the kind of detail that breaks a quick copy-paste from an older tutorial.
The generated report is organised into sections. Overview carries global details: record count, variable count, overall missingness, duplicates, memory footprint. Type inference is described in the README as automatic detection of column data types such as Categorical, Numerical and Date. Alerts is the part with the most direct engineering value: an automatic list of potential data quality issues, and the README names high correlation, skewness, uniformity, zeros, missing values and constant values among them. Reproduction records the technical details of the run, including time, version and configuration. That last section is what makes a report auditable later, because it ties the artifact to the configuration that produced it.
The analysis layer goes beyond per-column summaries. Univariate analysis produces descriptive statistics and distribution histograms. Multivariate analysis covers correlations, missing data patterns, duplicate rows and pairwise variable interaction. Time-series support adds autocorrelation and seasonality plus ACF and PACF plots. Text analysis reports the most common categories by case and separator, plus script and block detection. There is also file and image analysis covering file sizes, creation dates, dimensions, truncated image detection and EXIF metadata presence. Those last two are narrower than the headline suggests: they apply when your columns hold text or file references, not to ordinary numeric columns.
Getting it running, and the migration commands
Installation is two commands, one per ecosystem. The README gives pip install fg-data-profiling and conda install -c conda-forge fg-data-profiling. The documentation site is at docs.sdk.ydata.ai, and the README also links to ydata-profiling.ydata.ai/docs/master/ for the full documentation.
If you are coming from the old package, the migration guide is three steps. Uninstall the old distribution with pip uninstall ydata-profiling. Install the new one with pip install fg-data-profiling. Then update imports, replacing import ydata_profiling and from ydata_profiling import ProfileReport with import data_profiling and from data_profiling import ProfileReport. The README supplies a grep one-liner for finding affected files: grep -r "ydata_profiling". --include="*.py".
That grep is the piece worth running before anything else, because it tells you the size of the rewrite. It only covers Python files, so any notebook, documentation page, CI configuration or environment file that references the old name will not show up in the results and has to be checked separately.
Spark support and where the scaling story stops
The README describes Spark support as released, links to a Spark integration page in the documentation, and states that work is ongoing, inviting contributors. That is a meaningful distinction for anyone planning a production deployment. Pandas profiling is bounded by the memory of the machine holding the DataFrame, so the practical ceiling is the size of the frame you can load. Spark support is the path for data that does not fit that ceiling.
The README's own framing of Spark as work in progress, with a link to a projects board, is the strongest signal available. Treat the Spark integration as something to validate against your own cluster before you commit to it, and treat the Pandas path as the well-trodden one.
The report is a starting point, not a data quality gate
The Alerts section is the feature most likely to be misread. It lists potential issues: high correlation, skewness, uniformity, zeros, missing values, constant values. These are statistical observations about the data, not assertions about whether the data is correct. A constant column is a legitimate finding in a snapshot table. High correlation between two columns is expected in a join key pair. The profiler does not know your schema, so it cannot tell you which of its alerts matter.
The second limitation is the artifact itself. HTML and JSON are the documented output formats, alongside a Jupyter widget. An HTML report is a document, not an assertion you can fail a build on. If your pipeline needs a pass or fail decision, you will be reading the JSON output and writing your own thresholds against it. The third limitation is temporal. The README states the old package will receive no further updates or bug fixes, which means anyone still on the old import path is accumulating risk with every release they skip. That is a migration problem, not a profiling problem, but it is the one with a deadline attached.
How it compares to great_expectations
The closest well-known alternative is great_expectations, and the difference is in what each one produces. fg-data-profiling generates a report from a DataFrame with no prior configuration: you pass the frame, you get statistics, distributions, correlations and a list of alerts. great_expectations takes the opposite approach. You declare expectations about your data in advance, such as a column being non-null or within a range, and the tool validates incoming data against those declarations, producing a pass or fail result.
That difference determines the workflow. Profiling is exploratory and one-directional: it tells you what is in the data, once, and the output is for a human to read. Expectation-based validation is declarative and repeatable: it encodes what the data should look like and runs on every batch. If you are onboarding a new dataset and want to understand it, fg-data-profiling is the shorter path. If you need a test that fails when a column drifts, you need the other model, or you need to build it on top of the JSON output yourself. The two are complementary rather than competing, and the README's comparison feature, which produces a report comparing two datasets, is the closest thing here to a drift check.
Maintenance cost and the MIT licence
The package is MIT licensed, which is permissive and permits commercial use, modification and redistribution with the licence and copyright notice retained. That is the standard reading of MIT and it is the reason this project fits inside most corporate dependency policies without a legal review cycle. This is not legal advice; confirm the terms against your own policy.
The maintenance cost is concentrated in two places. First, the rename imposes a one-time migration across every repository, notebook and configuration that references the old name, and the grep one-liner only finds Python files. Second, releases keep coming: 4.18.4 and 4.19.1 were both published on 2026-04-22, and 4.20.0 followed on 2026-09-11. Frequent releases mean frequent version bumps if you pin strictly, and they also mean the API surface can move. Pinning a specific version and reviewing the changelog before upgrading is the cheaper posture, given that the README links to a changelog page in the documentation. The licence itself carries no ongoing cost; the upgrade discipline does.
Editorial conclusion
Adopt fg-data-profiling if you need a shareable profiling artifact from a Pandas or Spark DataFrame and you are willing to run the rename migration now. Do not adopt it if you need a stable package name across a long-lived codebase, or if you expect the HTML report to be your data quality gate rather than a starting point. Before installing, run grep -r "ydata_profiling" . --include="*.py" against your repositories to size the import rewrite, and verify that your pinned dependency lines are updated to fg-data-profiling rather than left on the old name.
Frequently asked questions
What does fg-data-profiling do with a DataFrame?
It gives you a one-line exploratory data analysis of a pandas DataFrame, in the spirit of df.describe() but extended, covering type inference, warnings about missing data, inaccuracies and skewness, univariate and multivariate analysis, time-series, text, and file and image analysis. The result exports as HTML, as JSON for automated systems, or as a widget in a Jupyter Notebook.
What are the best data profiling tools, and where does fg-data-profiling fit?
fg-data-profiling positions itself as one-line exploratory data analysis and data quality profiling for Pandas and Spark DataFrames: an extended df.describe() whose analysis exports to HTML, JSON or a Jupyter widget.
What is Pandas Profiling and how does fg-data-profiling handle the rename?
pandas-profiling is the older name, then ydata-profiling, and the distribution is now fg-data-profiling while the import is data_profiling. You load a pandas DataFrame as usual, then call ProfileReport(df, title="Profiling Report"), and the migration guide tells you to uninstall ydata-profiling, install fg-data-profiling, and find leftover ydata_profiling imports with a recursive grep.
Where does fg-data-profiling sit in an ETL pipeline?
The project does not frame profiling as an ETL stage, it frames it as one-line exploratory analysis of a DataFrame you hand it. The documented use cases are comparing multiple versions of the same dataset, profiling time-series data, tips for configuring the tool on large datasets, handling sensitive data, and producing dataset metadata and data dictionaries.
Official sources
Add this badge to your README
If you maintain this project, the badge below links readers to this analysis and shows its maintenance status from the daily GitHub snapshot. Paste the markdown into your README; add ?metric=license or ?metric=stars to the image URL for a different field.

[](https://hysenlabs.com/projects/data-centric-ai-community-fg-data-profiling)Star history chart for your README
[](https://hysenlabs.com/projects/data-centric-ai-community-fg-data-profiling)Was this useful?