Evidently: An Open-Source Observability Framework for ML and LLM Pipelines
Evidently is an open-source ML and LLM observability framework. Evaluate, test, and monitor any AI-powered system or data pipeline. From tabular data to Gen AI. 100+ metrics.
At a glance
- What is it?
- Evidently is a modular Python library for evaluating, testing, and monitoring machine learning and LLM systems, offering 100+ metrics, offline reports, and a self-hosted monitoring UI.
- Who is it for?
- Adopt Evidently if you need a flexible, code-first observability layer for both tabular ML and LLM pipelines, especially in Jupyter environments or as part of a self-hosted monitoring setup. Skip it if you require a fully managed service out of the box, as the open-source version lacks built-in alerting and multi-user features that Evidently Cloud provides.
- Can I use it commercially?
- Yes. Apache-2.0 is a permissive licence: you can use, modify and sell software built on it, as long as you keep its copyright and licence notices.
- Is it still maintained?
- Yes. The repository last received commits 46 days ago.
- What is it written in?
- Mainly Jupyter Notebook, according to GitHub's language statistics.
Answers come from the project's GitHub data, last synced on November 13, 2026, and from our analysis. They are not legal advice.
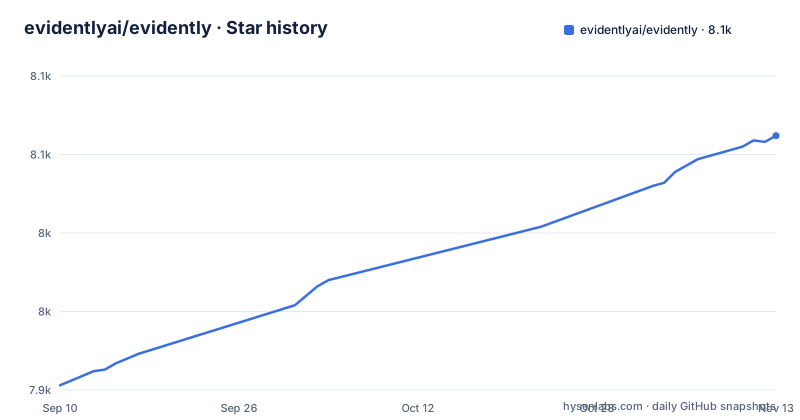
Star history
- evidentlyai/evidently8,062 ★ · +159
| Repository | 2026-09-10 | 2026-11-13 |
|---|---|---|
| evidentlyai/evidently | 7.9k | 8.1k |
159 Stars in the last 64 days, measured from the daily GitHub snapshot. Compare with other projects
Editorial analysis
What Evidently Actually Solves
Evidently addresses a common gap in ML and LLM operations: how to systematically check whether a model's inputs and outputs are still trustworthy after deployment. Traditional monitoring tools often focus on infrastructure metrics like latency and error rates, leaving data quality and prediction drift to ad-hoc scripts. Evidently provides a unified Python API to compute these checks, from basic column distribution shifts to LLM-specific evaluations like sentiment and refusal detection. The target user is a data scientist or ML engineer who wants to run evaluations in a notebook, export results for CI/CD, or stand up a lightweight monitoring service. It is not a full MLOps platform; it is a component that produces metrics and test outcomes you can integrate elsewhere.
The Core Mechanism: Reports, Presets, and Descriptors
The library's architecture revolves around three layers: Reports, Presets, and Descriptors. A Report is a container that runs one or more evaluations on a dataset. Presets are pre-assembled groups of metrics, such as DataDriftPreset for tabular shift detection or TextEvals for LLM outputs. Descriptors are row-level evaluators that add new columns to your dataset. For example, the README shows adding Sentiment, TextLength, and Contains descriptors to a DataFrame of questions and answers. Each descriptor computes a value per row, and then a preset like TextEvals summarizes those values into distributions. This two-stage design lets you inspect individual row scores before aggregating, which is useful for debugging why a particular response failed a quality gate. The run() method ties it together, producing an object that can render in Jupyter or export to JSON, dict, or HTML.
Getting Started: Commands and Code from the README
Installation is straightforward with either pip install evidently or conda install -c conda-forge evidently. The README walks through a minimal LLM evaluation: create a pandas DataFrame with questions and answers, wrap it in Dataset.from_pandas(), and attach descriptors. Then instantiate a Report with TextEvals() preset and call report.run(eval_dataset). The output object supports .json() and .dict() for programmatic access, and .save_html("file.html") for a shareable report. For tabular data, the example uses the iris dataset and DataDriftPreset(method="psi") to compare the first 60 rows as current data against the remaining rows as reference. The Report includes tests if you pass include_tests="True", which yields pass/fail results rather than just metrics. To launch the monitoring UI, the README suggests either uv run --with evidently evidently ui --demo-projects all or, after a standard pip install, the command evidently ui --demo-projects all, then visiting localhost:8000.
The Monitoring UI: Self-Hosted or Cloud
The open-source project includes a monitoring dashboard that runs locally and visualizes metrics and test results over time. The README points to a live demo and recommends Evidently Cloud for production use, citing a generous free tier and extras like dataset management, alerting, and no-code evals. This split is important: the UI is not a full observability platform in the OSS version. It lacks the operational features that teams often need, such as user roles and proactive alerts. The UI serves as a visualization layer for the reports you generate. The README's quick start launches it with the evidently ui command and demo projects.
A Real Limitation: The Gap Between Offline and Live Monitoring
One clear limitation is the step between running one-off reports and achieving continuous monitoring. The README's quick-start examples generate a report on a fixed dataset, and its monitoring example launches the UI with demo projects. The reference dataset is something you pass in yourself, as the iris example shows. The drift detection methods, like PSI, depend on a reference distribution, which may become stale as your system evolves. This is a common pitfall: a drift report is only as good as the reference it compares against.
Comparing Evidently to a DIY Approach or a Commercial Platform
The main alternative to Evidently is building custom evaluation scripts with pandas and scikit-learn, or adopting a commercial ML monitoring platform like Arize or WhyLabs. The DIY path gives you full control but requires reimplementing drift tests, LLM judges, and report generation, which is time-consuming and error-prone. Commercial platforms offer managed infrastructure, alerting, and integrations, but they often lock you into their data schema and pricing. Evidently sits in between: it gives you a rich set of metrics and a Python interface to export results, so you can integrate with your own stack. The key difference is that Evidently is not a SaaS by default; it is a library you run yourself. For a startup that wants to avoid vendor lock-in and has engineering capacity, this is attractive. For a team that wants minimal operational overhead, a commercial platform may be the better fit despite the cost.
Maintenance and License Implications
Evidently is licensed under Apache-2.0, which permits commercial use, modification, and redistribution without requiring you to open-source your own code. This is a permissive license, but it does not include a warranty, so you are responsible for validating that the metrics meet your needs. The project is actively maintained, with recent releases like v0.7.23 in September 2026, v0.7.21 in March 2026 and v0.7.20 in January 2026. The primary language listed is Jupyter Notebook, which reflects the notebooks in examples/; the library itself lives under src/ as a Python package. Upgrading between releases may introduce changes in API behavior, so you should pin versions in your environment or review changelogs before upgrading.
Editorial conclusion
Adopt Evidently if you need a flexible, code-first observability layer for both tabular ML and LLM pipelines, especially in Jupyter environments or as part of a self-hosted monitoring setup. Skip it if you require a fully managed service out of the box, as the open-source version lacks built-in alerting and multi-user features that Evidently Cloud provides. Before production deployment, verify that the 100+ metrics cover your specific data types and that the drift detection methods (e.g., PSI) align with your reference data strategy. Start with a simple Report on your own dataset to confirm the output format suits your workflow, then decide whether to add the UI.
Frequently asked questions
how to install evidently
Two documented routes: pip install evidently from PyPI, or conda install -c conda-forge evidently. Python 3.10 or later is required, with classifiers running through 3.13. The package is built with hatchling, and the version is read out of src/evidently/_version.py rather than written in the manifest.
what is evidently ai
An open-source framework to evaluate, test and monitor ML and LLM-powered systems, described as running from experiments to production. It works with tabular and text data, supports evals for predictive and generative tasks from classification to RAG, ships 100+ built-in metrics from data drift detection to LLM judges, and offers a Python interface for custom metrics.
what is evidently ai used for
Checking what the README lists: text descriptors such as length, sentiment, toxicity, language and regular expression matches; LLM outputs such as semantic similarity, retrieval relevance and summarization quality; data quality such as missing values, duplicates, min-max ranges, new categorical values and correlations; and data distribution drift. You can add custom evals through a Python interface.
how to use evidently
Build a Report from a preset or from individual metrics, run it against current and reference data, then read it interactively in Python or export it as JSON, a Python dictionary or HTML. Add pass/fail conditions to turn the Report into a Test Suite, which the README points at regression testing and CI checks. To see the monitoring UI locally, run evidently ui --demo-projects all and visit localhost:8000.
Official sources
Add this badge to your README
If you maintain this project, the badge below links readers to this analysis and shows its maintenance status from the daily GitHub snapshot. Paste the markdown into your README; add ?metric=license or ?metric=stars to the image URL for a different field.

[](https://hysenlabs.com/projects/evidentlyai-evidently)Star history chart for your README
[](https://hysenlabs.com/projects/evidentlyai-evidently)Was this useful?