categraf: one agent for the metrics and logs of a mixed estate
one-stop telemetry collector for nightingale
At a glance
- What is it?
- Categraf is a Go telemetry collector built for the Nightingale monitoring stack, gathering metrics and logs from physical machines, virtual machines, switches, containers, Kubernetes and a long list of middleware, then pushing them out with the remote write protocol. It is designed to replace a fleet of per-purpose agents with one binary, and it is MIT licensed.
- Who is it for?
- Adopt categraf if you run Nightingale, Prometheus or VictoriaMetrics and you want one agent to cover both metrics and logs across bare metal, virtual machines, containers and Kubernetes, and if your network policy prefers agents that push rather than servers that poll.
- Can I use it commercially?
- Yes. MIT is a permissive licence: you can use, modify and sell software built on it, as long as you keep its copyright and licence notices.
- Is it still maintained?
- Yes. The repository last received commits 5 days ago.
- What is it written in?
- Mainly Go, according to GitHub's language statistics.
Answers come from the project's GitHub data, last synced on November 7, 2026, and from our analysis. They are not legal advice.
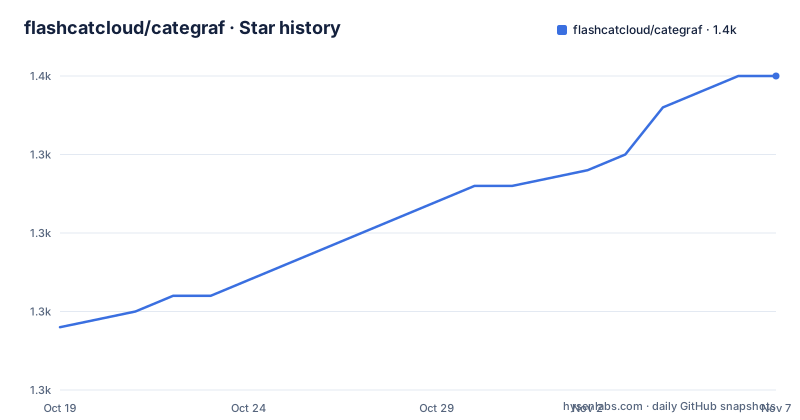
Star history
- flashcatcloud/categraf1,350 ★ · +16
| Repository | 2026-10-19 | 2026-11-07 |
|---|---|---|
| flashcatcloud/categraf | 1.3k | 1.4k |
16 Stars in the last 19 days, measured from the daily GitHub snapshot. Compare with other projects
Editorial analysis
All in one, across every kind of infrastructure
Categraf is described as an All-in-One data collector supporting metric and log collection, covering physical machines, virtual machines, switches, containers, Kubernetes and a range of middleware and databases, and working in hybrid cloud, cloud-native and multi-cloud architectures.
The stated ambition goes further than collection. The project expects to offer not only the ability to gather data but also dashboards and alert rules, aiming to work out of the box. That is a meaningful difference in scope, and it comes from the ecosystem: the README recommends Nightingale as the monitoring server, with dashboards and alert rules already built in, and points at Flashduty as the on-call platform, where alarm aggregation, noise reduction, claiming, escalation and scheduling are handled.
The four feature points in the README are worth reading as a design brief. It has close to a hundred built-in collection plugins, and it collects both metrics and logs, which reduces the number of agents you deploy and therefore the maintenance you do. It uses a push model, so for environments with strict network policy it reduces the dependency on inbound connections from outside. It pushes with the remote write protocol, so the same agent can write to Nightingale, Prometheus or VictoriaMetrics. And it tries to land best practices at the collection side, including handling high-cardinality risks in the time series store before they reach it.
That last one is the most interesting claim, because cardinality is the standard way a monitoring system falls over, and it is usually fixed downstream, after the damage.
Push mode, remote write, and the agent topology
The push decision has consequences for how the estate is operated. In a pull model, the monitoring server opens connections to every agent, which means inbound network access to every host, and that is a policy problem in a locked-down environment. With categraf pushing, the agent initiates the connection to the server, and the network requirement is outbound access to a known set of endpoints.
The protocol is remote write, the same one Prometheus uses for remote_write, which is why the same binary can serve Nightingale, Prometheus and VictoriaMetrics. The README also documents using categraf as a replacement for Prometheus scraping, with details in the prometheus/ directory of the repository, which is a separate deployment model from the push-to-backend one, and is the route to take when you have an existing Prometheus-shaped setup.
The configuration lives in a conf/ directory, TOML by the look of the error message the README quotes, and the directory is passed with the --configs flag, so one binary with one config directory can be shipped to many roles in an estate. The inputs/ directory holds the plugin implementations, and the README links to it as the list and documentation of what is available.
Underneath, the repository is a well-factored Go project: agent/ for the collection loop, writer/ for the output side, logs/ for the log path, parser/ for parsing, api/, config/, types/, pkg/ and set/ for the plumbing, plus heartbeat/ and ibex/ as the components the README does not explain.
Building from source, and the macOS tar trap
The build is a plain go build, with the module and proxy settings as environment variables, and then a tarball of the binary and the configuration:
# export GO111MODULE=on
# export GOPROXY=https://goproxy.cn

go build
tar zcvf categraf.tar.gz categraf conf
The macOS note that follows is the kind of warning that saves an afternoon. Users on macOS are told to use the gun-tar tool for packaging, installing it with brew install gnu-tar and then using gtar zcvf categraf.tar.gz categraf conf instead.
The reason is in the error message the README quotes. Without the GNU tar, the archive is created in a format the reader cannot parse, and the agent fails at startup with a message about the config directory and TOML files: files cannot contain NULL bytes, probably using UTF-16, and TOML files must be UTF-8. The error message points at the wrong thing entirely.
For packaged releases there is a.goreleaser.yaml at the root and a Makefile that derives the version from git describe, strips symbols and file paths from the binary with the -w and -s linker flags, and injects the version into the config package. The Makefile also has a vendor target that runs go mod vendor through the same proxy, and tidy and vendor-ci targets for continuous integration.
Running it: test mode first, then a config directory
The run commands are laid out in the README in a way that is worth copying, because the first two are a test mode that prints metrics to stdout instead of sending them anywhere. That is the fastest way to check that a plugin works on a new host before the agent is allowed near a monitoring server.
# test mode: just print metrics to stdout
./categraf --test

# test system and mem plugins
./categraf --test --inputs system:mem

# print usage message
./categraf --help

# run
./categraf

# run with specified config directory
./categraf --configs /path/to/conf-directory
The --inputs flag is the second thing to learn, because it selects which plugins are enabled. The same flag appears in both test and normal mode, so a team can start with two plugins, verify them, and widen the set as each is confirmed.
The last documented pattern is running it detached with nohup, redirecting output to stdout.log, which is the shape of a service started without a supervisor. There is a scripts/ directory in the repository for the packaged variants, and the Makefile has build targets for Linux and Windows, so the Windows path is a first-class part of the build rather than an afterthought, with winsvc in the dependency list and separate main files for posix, Windows and other platforms.
Three shapes in Kubernetes, and a sidecar that is only a demo
In Kubernetes, categraf can run as a daemonset, a deployment or a sidecar, and the repository ships a manifest for each under k8s/.
The procedure is to edit the manifest, replacing NSERVER_SERVICE_WITH_PORT with the service address of the nserver in your cluster and CATEGRAF_NAMESPACE with the namespace value, and then apply the files:
kubectl apply -n monitoring -f k8s/daemonset.yaml # collect metrics, metrics/cadvisor of node
kubectl apply -n monitoring -f k8s/sidecar.yaml # collect service metrics
kubectl apply -n monitoring -f k8s/deployment.yaml #collect apiserver coredns etc
The comments in those lines describe the division of labour, and it is the sensible one. The daemonset runs on every node and collects the node metrics and the cadvisor metrics. The deployment runs as a small set of pods and collects cluster-level things such as the apiserver and CoreDNS. The sidecar runs next to a workload and collects that service's metrics.
The README is explicit that the sidecar manifest is a demo and that you should replace the mock with your own image of the service. That is worth taking seriously, because a sidecar that ships with a placeholder image is the kind of thing that gets applied as-is and then quietly collects nothing.
Where Categraf is the wrong tool
The first wrong-tool case is an estate that has standardised on a different agent. The plugin model, the TOML configuration layout, the --inputs selection and the remote write output are categraf's own, so adopting it alongside an existing Telegraf or node_exporter deployment means running two collector stacks, which is exactly the fleet reduction the project is designed to avoid.
The second is a log-heavy environment with a dedicated logging pipeline. Categraf collects logs, and the README says that collecting metrics and logs in one agent reduces the number of agents deployed. But a first-class log pipeline ships with buffering, retries, backpressure and downstream indexing, and none of that is described here. A team whose logs are its main volume should read the logs/ part of the tree before assuming the agent is the right tier.
The third is a team that wants to pull rather than push. The push model is a deliberate answer to network policy, and it is the right answer in a locked-down network. Where inbound scraping is available and the monitoring server is the system of record, the pull model is simpler to reason about, and the README itself points at the Prometheus-compatible mode for teams coming from that world.
One more operational point: the project is closely tied to the Nightingale ecosystem, and while the remote write output keeps the data path open, the dashboards and alert rules that the README highlights are Nightingale's, not categraf's.
MIT, version 0.5.18, and a lineage from Telegraf
The project is MIT licensed, with the LICENSE file at the repository root, and it is published under the module path flashcat.cloud/categraf. The repository is not archived, and the last push was on 2026-09-09, with releases v0.5.18 on 2026-08-31, v0.5.17 on 2026-08-04 and v0.5.16 on 2026-07-23.
A version in the 0.5 line with releases every few weeks is a project that is still finding its shape, and it is also one where the changelog matters. The dependency list in go.mod shows the shape of the thing, and it is wide: the Prometheus client and the Prometheus server library itself for the compatible mode, gopsutil for the system metrics, gosnmp for switches, the Docker client for container metrics, the MySQL driver, pgx, the MongoDB driver, the Consul API client, the Kafka client, the InfluxDB line protocol, Kerberos support, the DNS library and the OpenTelemetry metric API. That is the close to a hundred plugins in one dependency list.
The acknowledgements name the lineage: Categraf is developed on the basis of Telegraf, Exporters and OpenTelemetry, and it thanks the open source community. That is the honest description of a project that takes a plugin architecture from one lineage, a remote write path from another and the instrumentation vocabulary from a third.
Editorial conclusion
Adopt categraf if you run Nightingale, Prometheus or VictoriaMetrics and you want one agent to cover both metrics and logs across bare metal, virtual machines, containers and Kubernetes, and if your network policy prefers agents that push rather than servers that poll. Do not adopt it if you already standardised on a single-purpose agent, since the plugin model and the configuration format are categraf's own, and do not expect it to replace a log pipeline, because the log side is part of the same agent rather than a separate shipping tier. Before you deploy, read the plugin list under inputs/ to confirm the plugins you need exist, decide whether you will run it as a daemonset, a deployment or a sidecar in Kubernetes, and check the version you pin, since the project ships frequent 0.5.x releases.
Frequently asked questions
What does Categraf collect?
It is an All-in-One collector for metrics and logs, covering physical machines, virtual machines, switches, containers, Kubernetes and various middleware and databases, with close to a hundred built-in collection plugins listed under the inputs/ directory of the repository.
Which backends can Categraf push to?
It uses the remote write protocol, so the same agent can push to Nightingale, Prometheus or VictoriaMetrics. The README also documents using categraf as a replacement for Prometheus scraping, with details in the prometheus/ directory.
How do I build Categraf from source?
Run go build and then tar zcvf categraf.tar.gz categraf conf. On macOS the README says to install GNU tar with brew install gnu-tar and package with gtar instead, otherwise the config fails to load with a TOML UTF-16 error.
How do I run Categraf in Kubernetes?
As a daemonset, a deployment or a sidecar, using the manifests in the k8s/ directory. Replace NSERVER_SERVICE_WITH_PORT with the nserver service address and CATEGRAF_NAMESPACE with your namespace, then apply the yaml with kubectl. The sidecar manifest is a demo and the mock image has to be replaced.
What licence is Categraf released under?
MIT, with the LICENSE file at the repository root, and the Go module path is flashcat.cloud/categraf. The most recent listed release is v0.5.18, dated 2026-08-31, and the last push was on 2026-09-09.
Official sources
Add this badge to your README
If you maintain this project, the badge below links readers to this analysis and shows its maintenance status from the daily GitHub snapshot. Paste the markdown into your README; add ?metric=license or ?metric=stars to the image URL for a different field.

[](https://hysenlabs.com/projects/flashcatcloud-categraf)Star history chart for your README
[](https://hysenlabs.com/projects/flashcatcloud-categraf)Was this useful?