Visual Blocks for ML: Graph Editing in Google Colaboratory
Visual Blocks for ML is a Google visual programming framework that lets you create ML pipelines in a no-code graph editor. You – and your users – can quickly prototype workflows by connecting drag-and-drop ML components, including models, user inputs, processors, and visualizations.
At a glance
- What is it?
- Visual Blocks adds a node-based editor for assembling machine learning pipelines from Python functions and built-in ML components. It is best suited to interactive prototyping in Google Colaboratory, not production pipeline orchestration.
- Who is it for?
- Researchers, educators, and application teams should adopt Visual Blocks when they need an interactive graph for experimenting with ML workflows in Google Colaboratory. Engineering teams that require versioned pipeline code, deployment controls, or production scheduling should first verify that Visual Blocks fits their delivery process.
- Can I use it commercially?
- Yes. Apache-2.0 is a permissive licence: you can use, modify and sell software built on it, as long as you keep its copyright and licence notices.
- Is it still maintained?
- Yes. The repository last received commits 130 days ago.
- What is it written in?
- Mainly TypeScript, according to GitHub's language statistics.
Answers come from the project's GitHub data, last synced on November 7, 2026, and from our analysis. They are not legal advice.
Star history
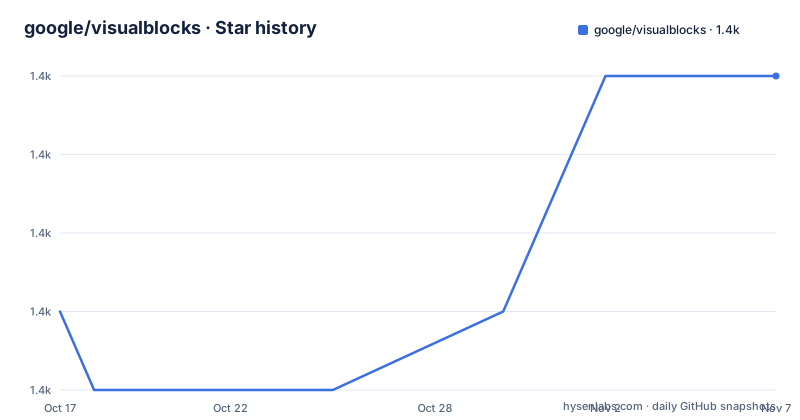
- google/visualblocks1,369 ★ · +3
| Repository | 2026-10-17 | 2026-11-07 |
|---|---|---|
| google/visualblocks | 1.4k | 1.4k |
3 Stars in the last 21 days, measured from the daily GitHub snapshot. Compare with other projects
Editorial analysis
Visual Blocks Targets Interactive ML Prototyping
Visual Blocks addresses a specific gap between writing notebook code and handing a pipeline to people who would rather manipulate a graph. Machine learning workflows often include several distinct operations: accepting an image or microphone signal, running a model, transforming intermediate data, and displaying a result. Encoding those stages as Python control flow works for developers, but it gives users less room to rearrange the experiment visually. The framework therefore targets pipeline authoring, model evaluation, data pipelining, and experimentation within an interactive application.
The intended audience includes developers building visual ML tooling, researchers who want to prototype multimedia applications, and users who interact with those applications through a graph. It is not positioned as a general deployment engine. Its strongest documented path is Google Colaboratory, where Python functions defined in a notebook can be registered with Visual Blocks and made available as nodes.
This distinction matters. A visual graph can make pipeline structure easier to inspect and modify, but the README does not describe scheduling, retries, resource quotas, durable job state, or deployment. Those omissions make it premature to treat the graph editor as a replacement for a production workflow system. The project is better read as an interface and execution layer for experimentation, with the host application remaining responsible for the surrounding environment.
JSON Graphs Connect Angular Nodes to a Runtime
The repository describes three connected parts. The node graph editor is a custom Angular component. It accepts a JSON object describing nodes, including their inputs, outputs, and properties, and emits the graph structure when the user changes it. Events such as adding a node or deleting an edge are therefore represented as graph updates rather than as changes to handwritten UI code.
The second part is a library of ML nodes. The documented categories include Models, I/O such as camera, image, and microphone components, and visualizations. These nodes give the graph concrete interaction points. A user can connect an input component to a processing stage, select a model, and route results toward a visualization instead of assembling that sequence in notebook cells.
At runtime, the runner receives a graph JSON file and a list of nodes. It traverses the graph to determine execution order. For each node, it loads the corresponding Angular component and invokes that component's run function. This is the core data flow: notebook functions become registered nodes, the editor records their relationships, and the runner uses those relationships to select the order of execution.
The documentation does not expose details about error propagation, cancellation, retries, or partial graph failure. Those behaviors should be treated as unconfirmed rather than assumed from the existence of a runtime. The repository layout includes `custom_nodes/`, `examples/`, `pipelines/`, `python/`, and `scripts/`, but the README does not define extension packaging rules or a public API for registering arbitrary non-Python components.
Google Colaboratory Setup Registers Python Inference Functions
The documented first use begins in a Google Colaboratory notebook. The README identifies `pipelines/` as a gallery of end-to-end applications, including 3D photos, a manuscript helper with large language models, and cartoonization. The quickest named notebook example is `examples/quick_start_style_transfer.ipynb`, while `examples/quick_start_cartoonization.ipynb` is another example file in the repository.
Install the Python package in a notebook cell:
!pip install visualblocksNext, define an inference function. Visual Blocks supports three documented function types. A `generic` function accepts input tensors and returns output tensors. A `text_to_text` function accepts strings and returns output strings. A `text_to_tensors` function accepts strings and returns output tensors. Tensor inputs and outputs are lists of NumPy arrays, and their dimensions must match the model's expected tensor dimensions.
The function must also import any packages required by the chosen model. The README points TensorFlow and TensorFlow Lite users to TF Hub instructions and directs others to the example notebooks. Since no concrete model-loading function is supplied in the documentation, a first pipeline cannot be reproduced as a complete inference implementation without selecting and coding the model dependency.
Dynamic Registration Simplifies Notebook Function Updates
Visual Blocks offers two paths for connecting notebook Python functions to the editor. Dynamic registration uses `register_vb_fn`, which is useful when changes to an inference function should appear in the Visual Blocks UI without restarting the Visual Blocks server.
Import the decorator:
from visualblocks import register_vb_fnFor a generic inference function, apply the decorator to the function:
@register_vb_fn(type='generic')
def my_generic_inference_function(tensors):
  # ...
The decorator's documented type values are `generic`, `text_to_text`, and `text_to_tensors`. The README's earlier placeholder syntax uses `[inference_function_type]`, but that placeholder is not a literal value that should be copied. A working declaration must select one of the three supported strings.
This registration route keeps the server constructor independent of individual functions. It is particularly relevant while editing a notebook because the UI can reflect registered functions without restarting the server. However, the documentation does not state whether decorator registration is synchronized when a function's signature changes after decoration. It also does not explain how duplicate names are handled. Those are implementation details to check in the chosen example notebook before depending on hot reloading behavior.
Starting the Server Opens the Graph Editor
Without decorators, inference functions are passed to `visualblocks.Server()` by type. One generic function can be supplied directly:
import visualblocks
server = visualblocks.Server(generic=my_fn1)
Several functions can be grouped in tuples, and different supported types can be passed together:
server = visualblocks.Server(generic=(my_fn1, my_fn2), text_to_text=(my_fn3))When `register_vb_fn` has already registered the functions, the server requires no function arguments:
import visualblocks
server = visualblocks.Server()
Display the interactive graph environment from a separate notebook cell:
server.display()After the UI appears, a registered generic function can be selected from the "Colab (generic)" node in the "Model" category. This is the first point at which the notebook function participates in the graph workflow. The user can connect the node to compatible inputs and outputs, then execute the graph through the interface described by the project.
The README does not include a complete first graph definition, node placement sequence, or screenshot with exact control labels for every operation. The named example notebooks therefore matter. They are the best documented route for seeing how a model function, input, and visualization are connected in a working notebook.
License and Repository Maintenance Boundaries
Visual Blocks is distributed under the Apache-2.0 license. The repository has an `Apache-2.0` `LICENSE` entry, which defines the permission, notice, and patent conditions that apply to use of the project. This is a factual statement about the repository's stated license, not legal advice.
The repository is not archived. Its last push was on 2026-07-01. No GitHub releases are listed, so there is no documented release cadence or versioned upgrade path in the available project information. Installation through the README uses the package name without a version constraint:
!pip install visualblocksThat command leaves version selection unspecified. For a repeatable notebook environment, the unavailable dependency and package versions would need to be recorded separately by the adopter. The README also does not document a rollback procedure, release compatibility matrix, or migration notes for graph JSON files.
The separation between the JavaScript front-end editor, its embedding library, and the Python package creates a real upgrade cost. A team adopting the framework would need to determine whether its notebook package, graph editor, custom nodes, and saved graph JSON are versioned together. The available repository information does not answer that question.
Why Code-First Notebooks Remain a Valid Alternative
A conventional code-first notebook is the clearest alternative for teams that prefer explicit Python control flow. Instead of registering functions and arranging them in the Visual Blocks editor, a developer can call notebook functions directly, store intermediate values in notebook variables, and control execution with Python. That approach makes the execution sequence visible in code and avoids depending on a graph editor's node-selection and connection behavior.
The practical difference is interface rather than model capability. Visual Blocks adds a visual representation, reusable ML nodes, and a runtime that traverses a graph. Code-first notebooks keep orchestration in Python and are easier to pair with ordinary diffing, static analysis, and code review conventions. Visual Blocks is more appropriate when a host application needs to expose pipeline structure to users who benefit from dragging, connecting, and visually inspecting components.
Visual Blocks would be the wrong tool when the central requirement is a supported production scheduler or deployment lifecycle. It would also be a poor fit for a function that does not conform to the documented data contracts, including the requirement that tensor inputs and outputs be lists of NumPy arrays with model-compatible dimensions. The framework can reduce the amount of UI and orchestration code a platform must build, but it does not remove the need to manage model dependencies or host-environment compatibility.
Editorial conclusion
Researchers, educators, and application teams should adopt Visual Blocks when they need an interactive graph for experimenting with ML workflows in Google Colaboratory. Engineering teams that require versioned pipeline code, deployment controls, or production scheduling should first verify that Visual Blocks fits their delivery process. For an initial adoption, confirm that model dependencies run in the notebook environment and that every registered function accepts and returns tensors with compatible dimensions.
Frequently asked questions
How do I install Visual Blocks in Google Colaboratory?
Run `!pip install visualblocks` in a notebook cell. The README then directs users to define an inference function, create a `visualblocks.Server`, and call `server.display()`.
Which inference function types does Visual Blocks support?
The documented types are `generic`, `text_to_text`, and `text_to_tensors`. Tensor-based functions accept lists of NumPy arrays as inputs and return lists of NumPy arrays with dimensions compatible with the model.
When should I use register_vb_fn instead of passing functions to Server?
The README presents `register_vb_fn` as the way to expose function changes in the UI without restarting the Visual Blocks server. Without the decorator, pass functions to `visualblocks.Server()` using their inference type.
Official sources
Add this badge to your README
If you maintain this project, the badge below links readers to this analysis and shows its maintenance status from the daily GitHub snapshot. Paste the markdown into your README; add ?metric=license or ?metric=stars to the image URL for a different field.

[](https://hysenlabs.com/projects/google-visualblocks)Star history chart for your README
[](https://hysenlabs.com/projects/google-visualblocks)Was this useful?