Loki: Log Aggregation That Skips Full-Text Indexing
Like Prometheus, but for logs. By storing compressed, unstructured logs and only indexing metadata, Loki is simpler to operate and cheaper to run.
At a glance
- What is it?
- Grafana Loki trades full-text search for label-based indexing to keep log storage cheap and simple. This review covers its architecture, setup, limitations, and the trade-offs you should weigh before adopting it.
- Who is it for?
- Adopt Loki if you run Kubernetes and want a log system that shares labels with Prometheus, and if you can live without full-text search. Do not adopt it if your workflows depend on searching raw log text or if you need a single tool for both logs and metrics.
- Can I use it commercially?
- Yes, with strict conditions. AGPL-3.0 is a network copyleft licence: if people use a modified version over a network, for example as a hosted service, you must offer them its source code under the same licence.
- Is it still maintained?
- Yes. The repository received new commits within the last day.
- What is it written in?
- Mainly Go, according to GitHub's language statistics.
Answers come from the project's GitHub data, last synced on November 13, 2026, and from our analysis. They are not legal advice.
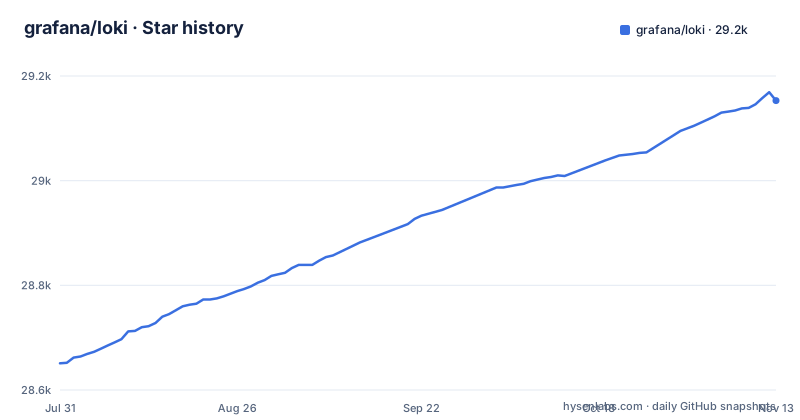
Star history
- grafana/loki29,153 ★ · +502
| Repository | 2026-07-31 | 2026-11-13 |
|---|---|---|
| grafana/loki | 28.7k | 29.2k |
502 Stars in the last 105 days, measured from the daily GitHub snapshot. Compare with other projects
Editorial analysis
The Problem: Log Storage That Costs Too Much or Searches Too Much
Most log aggregation systems index every word in every log line. That makes search fast but storage and operation expensive. Loki takes the opposite path. It stores compressed, unstructured logs and indexes only a set of labels for each log stream. The README is explicit: Loki does not do full text indexing on logs. This design makes it cheaper to run and simpler to operate, but it also sets a hard boundary on what you can query. The intended user is someone already running Prometheus and Kubernetes. Loki reuses the same label model as Prometheus, so you can switch between metrics and logs using the same labels. If you are not already invested in Prometheus labels, Loki's core value proposition weakens.
Push, Not Pull: How Loki Differs from Prometheus
Loki is inspired by Prometheus but diverges in a key mechanism. Prometheus pulls metrics from targets. Loki receives logs via push. The README states this directly: Loki delivers logs via push, instead of pull. That means an agent, Grafana Alloy, is responsible for gathering logs and sending them to Loki. Promtail is now feature complete and future development has moved to Alloy. This push model fits Kubernetes well because Pod labels can be scraped and indexed automatically. The architecture has three components: Alloy for collection, Loki for storage and query processing, and Grafana for querying and display.
Getting Loki Running: Components and Commands
The README points to the installation and getting started guides at grafana.com/docs/loki/latest. It does not include a quick start command in the README itself, but the structure is clear. You install Loki, install Alloy, and then configure Grafana to use Loki as a datasource, which requires Grafana v6.0 or later. The documentation sections list the API for getting logs in, the labels guide, and the operations guide. The Docker Driver Client is a Docker plugin that sends logs directly to Loki from Docker containers. LogCLI provides a command-line interface for querying logs. Loki Canary monitors an installation for missing logs. The Getting started section links out to the official docs for installation. Expect to configure Alloy to scrape your log sources and push them to Loki's API endpoint.
The Helm Chart Fork: A Concrete Operational Risk
Effective March 16, 2026, the Grafana Loki Helm chart is forked to a new repository, grafana-community/helm-charts. The chart in the Loki repository will continue to be maintained for GEL users only. GEL likely refers to Grafana Enterprise Logs, though the README does not expand the acronym. This is a significant operational detail. If you use the Helm chart to deploy Loki, your upgrade path changes. The community chart moves to a different repository, and the main repo chart may diverge. This is not a hypothetical concern. The README flags it with a warning and points to issue #20705 for details. Before adopting Loki, check that issue and decide whether you are comfortable with the community fork's maintenance cadence. This is exactly the kind of thing that bites teams six months into a deployment.
What You Cannot Do: The Full-Text Search Limitation
The biggest limitation is also the design's core. Loki does not index log contents, only labels. That means you cannot run a query like "find every line containing the string 'connection refused' across all services." You must first narrow down by labels, such as service name and pod, then filter the content. The README does not describe the query language in detail, but the absence of full-text indexing is clear. For incident investigations where you know the service and time range, this is fine. For exploratory search across an entire cluster, it is the wrong tool. The label-based approach works only if you have already assigned meaningful labels at ingestion. If you collect logs without labels, you have effectively built a black hole.
Alternatives: Elasticsearch and the Full-Text Approach
The natural alternative is Elasticsearch, which does full-text indexing on log contents. The difference is fundamental. Elasticsearch lets you search any substring across all logs, but it requires more storage and more operational effort. Loki deliberately sacrifices that capability to reduce cost and complexity. The README positions Loki against other log aggregation systems by emphasizing that it does not do full-text indexing. If your team already runs Elasticsearch and has the operational capacity, switching to Loki means giving up search features you may rely on. If you are starting fresh and your queries are label-driven, Loki's approach is simpler. There is no middle ground in the README. You must choose between indexing content or indexing only metadata.
Licence and Maintenance Costs
Loki is licensed under AGPL-3.0. That is a strong copyleft licence. If you modify Loki and distribute it as a service, you may need to release your modifications. For internal use, this is usually not a problem. For vendors who embed Loki, it is a serious consideration. Maintenance cost is visible in the release cadence. The repository shows v3.7.9 and v3.6.19 as recent releases, both published on 2026-10-20. The last push was on 2026-11-02, which suggests active development. The README also notes that Promtail is feature complete, so you will not get new features there. Upgrades require reading the dedicated upgrading guide. The Helm chart fork adds another maintenance surface. Budget time for tracking both the main project and the chart repository.
Editorial conclusion
Adopt Loki if you run Kubernetes and want a log system that shares labels with Prometheus, and if you can live without full-text search. Do not adopt it if your workflows depend on searching raw log text or if you need a single tool for both logs and metrics. Before committing, verify your retention and cardinality requirements against Loki's label model, and test the Helm chart migration path to grafana-community/helm-charts if you rely on the current chart.
Frequently asked questions
What is Grafana Loki used for?
Grafana Loki is a horizontally-scalable, multi-tenant log aggregation system inspired by Prometheus. It stores compressed, unstructured log content and indexes only a set of labels per stream, which is what the project says makes it cheaper to run and simpler to operate, and it is described as an especially good fit for Kubernetes pod logs.
Is Grafana Loki deprecated?
Nothing in the repository says so. The last push was on 2026-11-02, releases v3.7.9 and v3.6.19 were published on 2026-10-20, and the documentation offers both a latest release and an upcoming release at the tip of the main branch. The one movement the README does flag is the Helm chart, forked to grafana-community/helm-charts.
Is Grafana Loki free or paid?
The code is under the AGPL-3.0 licence, with a LICENSING.md file at the root of the repository. Where the paid distinction shows up in this repository is the Helm chart: since 2026-03-16 the in-repository chart is maintained for GEL users only, and the general chart lives in grafana-community/helm-charts.
How do I install Grafana Loki?
The README links installation documentation for Loki and for Alloy, plus a getting started page. The runnable paths are the examples directory with getting-started, ha-monolithic and nomad topologies, an operator, a Helm chart that now lives in grafana-community/helm-charts, and Nix.
What is the difference between Grafana Loki and Alloy?
They are two parts of the same stack. Alloy is the agent that gathers logs and sends them to Loki, Loki is the service that stores the logs and processes the queries, and Grafana does the querying and display. Alloy replaced Promtail, which the project considers feature complete, with future log-collection development going into Grafana Alloy.
Is Loki better than Splunk?
The repository makes no comparison with Splunk, so the case has to be read from Loki's own stated position. It compares itself with Prometheus: logs instead of metrics, push instead of pull, labels indexed instead of the text of the lines, and a single binary with nothing else to run.
Official sources
Add this badge to your README
If you maintain this project, the badge below links readers to this analysis and shows its maintenance status from the daily GitHub snapshot. Paste the markdown into your README; add ?metric=license or ?metric=stars to the image URL for a different field.

[](https://hysenlabs.com/projects/grafana-loki)Star history chart for your README
[](https://hysenlabs.com/projects/grafana-loki)Was this useful?