go install gives you a Prometheus binary with no React UI unless you build it
Prometheus is a monitoring system and time series database that pulls metrics over HTTP, evaluates PromQL rule expressions, and triggers alerts on specified conditions.
At a glance
- What is it?
- A CNCF monitoring system in Go, Apache-2.0, at 3.15.1, with 3.16.0-rc.2 published since. Its own build instructions say the go install path produces a binary that only runs from the clone root and has no React UI, that the repository is not designed to be used as a library, and that make docker will not produce a working image locally. The README tells you to check npm; the Makefile installs the UI with pnpm.
- Who is it for?
- Use Prometheus as a monitoring server, which is what this repository builds, and take the precompiled binary or the container image rather than building it, since the recommended install is the latest production release binary and both of the source paths documented here carry a trap.
- Can I use it commercially?
- Yes. Apache-2.0 is a permissive licence: you can use, modify and sell software built on it, as long as you keep its copyright and licence notices.
- Is it still maintained?
- Yes. The repository received new commits within the last day.
- What is it written in?
- Mainly Go, according to GitHub's language statistics.
Answers come from the project's GitHub data, last synced on November 13, 2026, and from our analysis. They are not legal advice.
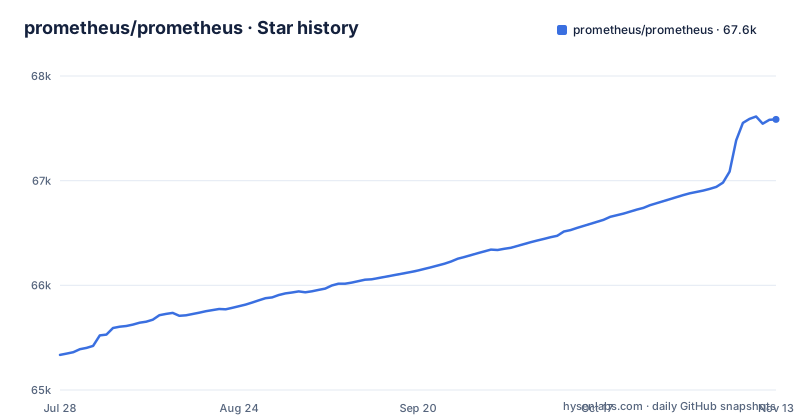
Star history
- prometheus/prometheus67,585 ★ · +2,250
| Repository | 2026-07-28 | 2026-11-13 |
|---|---|---|
| prometheus/prometheus | 65.3k | 67.6k |
2,250 Stars in the last 108 days, measured from the daily GitHub snapshot. Compare with other projects
Editorial analysis
The Architecture overview heading is followed immediately by the next heading
The README has a section titled Architecture overview, and in the text the next line is the Install heading, with no prose between them. The opening line directs you to prometheus.io for the full documentation, examples and guides. A structural fact the README does give is in the feature list, where no dependency on distributed storage and autonomous single server nodes appears as one of the eight things that distinguish Prometheus from other metrics and monitoring systems. That is a constraint stated as a feature, and the answer to the question it raises, horizontal scale, is the last bullet in the same list, support for hierarchical and horizontal federation.
go install produces a binary that only runs from the clone root and has no web UI
The source build instructions offer two paths and warn about only one of them. The first is to use the go tool to build and install the prometheus and promtool binaries into your GOPATH:
go install github.com/prometheus/prometheus/cmd/...
prometheus --config.file=your_config.yml
Then comes the however. When built that way, Prometheus expects to read its web assets from local filesystem directories under `web/ui/static`, so you have to run it from the root of the cloned repository, and that directory does not include the React UI unless it has been built explicitly with `make assets` or `make build`. So the binary lands in your PATH and looks installed while behaving like a checkout. The alternative is one line:
make build
./prometheus --config.file=your_config.yml
That path compiles the web assets in so the binary can be run from anywhere. The consequence is that the go install route gives you a process with no React UI and a working directory requirement.
The repository states outright that it is not designed to be used as a library
This is the clearest statement of scope in the file, and it is worth quoting rather than paraphrasing. The prometheus/prometheus repository builds a stand-alone program and is not designed for use as a library. The project says it is aware that people do use parts as such and does not put any deliberate inconvenience in the way, but that no care has been taken to make it work well as a library, and that you may encounter errors that only surface when used as a library. It then points at the right targets: repositories such as prometheus/common and prometheus/client_golang are designed as reusable libraries. The consequence is that embedding the server package is a decision you are making against an explicit statement, and the class of failure you are warned about is the awkward one, an error that does not appear until the code is used in a way the project never exercised.
make docker is documented as CI-only, and the working local path goes through promu
The Docker build section names its own trap in a single sentence: the `make docker` target is intended only for use in the project's CI system and will not produce a fully working image when run locally. The commands that do work are three, and they run in order:
make promu
promu crossbuild -p linux/$(go env GOHOSTARCH)
make common-docker-current-arch
Cross-compiling to a different architecture means replacing `$(go env GOHOSTARCH)` with one of the values in `DOCKER_ARCHS` from Makefile.common, such as `amd64`, and running the matching `make common-docker-<architecture>` target. Two limits fall out of that. The first is that the documented local path is Linux only, since both the crossbuild platform argument and the Makefile's own protoc selection are spelled `linux/`. The second is that the Dockerfile is not a self contained build: it copies from a `.build/${OS}-${ARCH}/` directory that the promu step populates, so the image cannot be produced from the Dockerfile alone.
The README tells you to check npm while the Makefile installs the UI with pnpm
The build prerequisites are given as three lines: Go at the version in go.mod or greater, NodeJS at the version in web/ui/.nvmrc or greater, and npm version 10 or greater, with an instruction to check it with `npm --version`. The Makefile disagrees about the package manager. The UI targets run `cd web/ui && pnpm install`, and the version bump and npm dependency update targets are separate scripts, one called with `minor` and one with `latest`, alongside a dedicated `ui-bump-version` target. So the tool the README tells you to verify is not the tool the build uses for the web interface, and pnpm appears in the build without appearing in the prerequisites. The consequence is a contributor who has satisfied the documented requirements exactly and still has the UI build fail on a missing or mismatched pnpm, with the error pointing at a step the README said nothing about.
The protoc the Makefile fetches is pinned to 3.15.8 and named for Linux only
Inside the Makefile, the protocol buffer compiler is not discovered from the system. A variable pins it to 3.15.8, and a URL is assembled from that version, a linux directory and one of two architecture names, aarch_64 or x86_64, chosen by a conditional on whether GOHOSTARCH is arm. There is no macOS or Windows variant of that URL anywhere in the line. It sits alongside other pinned tooling, with a yacc version at v0.6.0 and a golangci-lint timeout at four minutes, and next to a conditional that skips the UI build entirely when PREBUILT_ASSETS_STATIC_DIR is set. The module file is the other half of the toolchain story, and it declares `go 1.26.10`, a patch level rather than the minor version most modules use. The consequence is that the build expects a specific recent Go toolchain and, for the protobuf step, a Linux host, since the protoc download URL is spelled for Linux.
remove_all_sd then enable_<name>_sd is set arithmetic, and the same tags live in two files
Service discovery is compiled in rather than configured at runtime, and the mechanism has a shape worth understanding before you use it. The available tags are `remove_all_sd`, which excludes all optional service discoveries while keeping file_sd, static_sd and http_sd, and `enable_<name>_sd`, which re-enables one specific discovery when remove_all_sd is in effect. A minimal build therefore looks like this:
build:
    tags:
        all:
            - netgo
            - builtinassets
            - remove_all_sd
            - enable_kubernetes_sd
Two things follow. The tags are set arithmetic rather than an ordered list, so removing a discovery and re-adding a different one is the normal edit and the order carries no meaning. And the same setting lives in two different places depending on how you build: in `.promu.yml` under `build.tags.all` for `make build`, and on the command line for a direct `go build`. The consequence is that two checkouts with different `.promu.yml` files can produce binaries with genuinely different discovery capabilities, and the running process will not tell you which set it has.
The container runs as nobody, and the one published Go artifact is labelled experimental
Two details from the Dockerfile and the remote write section set the boundaries of this project. The image declares a busybox base for the OS and architecture arguments, copies the two binaries plus an example configuration, LICENSE and NOTICE, sets the working directory to /prometheus, chowns that directory and /etc/prometheus to nobody and makes the working directory group writable, then switches to `USER nobody`, exposes 9090, declares /prometheus as a volume and sets the command to `--config.file=/etc/prometheus/prometheus.yml` with `--storage.tsdb.path=/prometheus`. So the configuration path and the storage path are baked into the default command, and the storage path is the volume. Separately, the Remote Write protobuf is published independently at buf.build and can be fetched with `go get buf.build/gen/go/prometheus/prometheus/protocolbuffers/go@latest`, and the section says immediately afterwards: this is experimental. Around all of this the tree carries a second Dockerfile, a distroless variant, plus AGENTS.md and CLAUDE.md, and the repository shows 66,905 stars, 10,969 forks and 1,040 open issues.
Editorial conclusion
Use Prometheus as a monitoring server, which is what this repository builds, and take the precompiled binary or the container image rather than building it, since the recommended install is the latest production release binary and both of the source paths documented here carry a trap. Do not import prometheus/prometheus as a Go library, because the project says plainly that it is not designed for that and that errors surface only under library use; use prometheus/common or prometheus/client_golang instead. If you must build from source, use make build rather than go install so the assets are compiled in, keep the SD build tag list in .promu.yml in step with what you actually want, and ignore make docker, which the README says is intended only for the project's CI system.
Frequently asked questions
how to install prometheus
The recommended route is the precompiled binary for the latest production release, from the download section on prometheus.io. Docker images are on Quay.io and Docker Hub, and a container can be started with `docker run --name prometheus -d -p 127.0.0.1:9090:9090 prom/prometheus`, which binds to loopback and is then reachable at localhost:9090. Building from source needs Go, NodeJS and npm.
how to use prometheus
It collects metrics from configured targets at intervals, evaluates rule expressions, displays results and can trigger alerts when specified conditions are observed. The eight stated distinguishing features include a multi-dimensional data model, PromQL, an HTTP pull model, targets discovered by service discovery or static configuration, and no dependency on distributed storage so single server nodes are autonomous.
how to use prometheus monitoring
The pull model is the normal route: Prometheus scrapes targets it has been told about through service discovery or static configuration. The exception is batch work, where the feature list says pushing time series is supported via an intermediary gateway. The feature list gives only that one line about it; the README points to prometheus.io for the full documentation.
how to use prometheus in kubernetes
Kubernetes service discovery is a compiled-in build tag, and the build tag example in this repository re-enables it explicitly with `enable_kubernetes_sd` alongside `remove_all_sd`. The tags go in `.promu.yml` under `build.tags.all` for `make build`, or on the command line for a direct `go build`, and the set of discoveries a binary supports is fixed at compile time.
how to use prometheus push gateway
The feature list states that pushing time series is supported via an intermediary gateway for batch jobs, and the README points to prometheus.io for the full documentation, examples and guides.
Official sources
Where developers are discussing it
Posts on Hacker News, dev.to and Lobsters that link to this repository, found by our scan of those communities. 1 in the last 30 days; newest first.
- Don't Write More Prompts. Install These 10 Trending 'Skills' Insteaddev.to · Nov 8, 2026 · 18 points · 6 comments
Add this badge to your README
If you maintain this project, the badge below links readers to this analysis and shows its maintenance status from the daily GitHub snapshot. Paste the markdown into your README; add ?metric=license or ?metric=stars to the image URL for a different field.

[](https://hysenlabs.com/projects/prometheus-prometheus)Star history chart for your README
[](https://hysenlabs.com/projects/prometheus-prometheus)Was this useful?