hrbrthemes for ggplot2 typography, palettes, and scales
:lock_with_ink_pen: Opinionated, typographic-centric ggplot2 themes and theme components
At a glance
- What is it?
- hrbrthemes is an R package for developers who want opinionated ggplot2 themes, font aliases, categorical palettes, continuous scales, and small chart utilities. It favors typography-driven chart styling, but font availability, a custom licence classification, and limited release history require attention before adoption.
- Who is it for?
- Adopt hrbrthemes when a team already works in R and ggplot2 and wants a shared typographic chart style without building every theme setting and palette internally. Do not adopt it for a publication that requires guaranteed font availability across unmanaged systems, or when an unclassified custom licence conflicts with your organization's approved licence list.
- Can I use it commercially?
- Check first. The repository uses a licence we do not classify automatically, so read its LICENSE file before any commercial use.
- Is it still maintained?
- Yes. The repository last received commits 22 days ago.
- What is it written in?
- Mainly R, according to GitHub's language statistics.
Answers come from the project's GitHub data, last synced on November 6, 2026, and from our analysis. They are not legal advice.
Star history
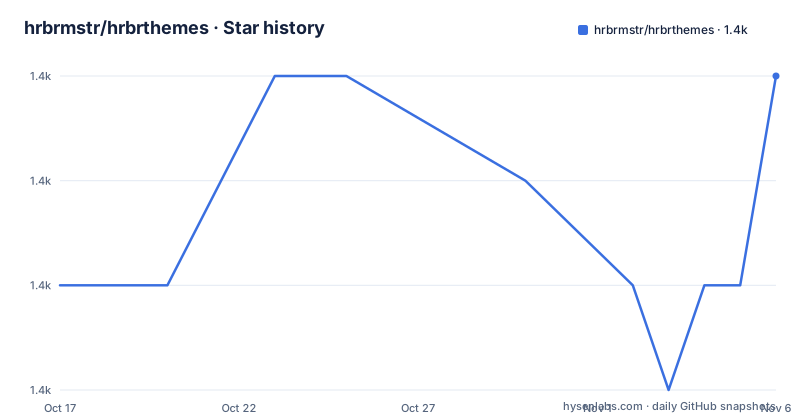
- hrbrmstr/hrbrthemes1,359 ★ · +2
| Repository | 2026-10-17 | 2026-11-06 |
|---|---|---|
| hrbrmstr/hrbrthemes | 1.4k | 1.4k |
2 Stars in the last 20 days, measured from the daily GitHub snapshot. Compare with other projects
Editorial analysis
Why hrbrthemes targets ggplot2 chart styling
hrbrthemes addresses a specific problem in R graphics: making plots look deliberate when a team has no shared ggplot2 style guide or does not want to assemble typography, axes, palettes, and geom defaults for every project. It is aimed at R users who already use ggplot2, especially developers producing statistical charts, reports, dashboards, or presentation graphics that need a recognizable visual treatment. The package is focused rather than general purpose. Its exported surface is organized around themes, scales, named colors, font aliases, palette data, and a small collection of utilities.
The central `theme_ipsum` theme uses Arial Narrow. The README describes that font as condensed, equipped with kerning pairs and geometric numbers. It also states that Arial Narrow should be installed on most modern systems, although that assumption can create deployment problems when charts are rendered on servers, containers, or systems managed outside the author's environment. Other themes use Archivo SemiCondensed, Econ Sans Condensed, Goldman Sans Condensed, IBM Plex Sans, Public Sans, Roboto Condensed, and Titilium Web.
The package therefore treats typography as a chart-design decision rather than leaving every font setting to individual plots. It is most useful when several ggplot2 charts need one coherent style. A one-off chart that already has house-specific formatting may gain little from the dependency.
The theme and scale layer in hrbrthemes
Based on the exported functions and repository layout, the package extends ggplot2 rather than replacing it. Theme functions supply complete visual defaults, while scale functions control labels, color mapping, fill mapping, and continuous interpolation. The separation matters because a theme does not determine the semantic mapping of a variable. A chart can use the requested typography and still need an explicit scale to format percentages, commas, discrete categories, or continuous values.
The documented axis helpers include `scale_x_comma`, `scale_y_comma`, `scale_x_percent`, and `scale_y_percent`. The README groups them as X and Y scales with opinionated presets for percent and comma label formats. Color and fill helpers include `scale_color_ipsum`, `scale_colour_ipsum`, `scale_fill_ipsum`, corresponding FT variants, Bit12 scales, and several Flexoki scales. Naming both `color` and `colour` variants is useful for codebases that follow different ggplot2 spellings, although the duplicate naming can also increase the number of choices a maintainer has to document.
The package also exposes utility functions such as `flush_ticks`, `humanize_duration`, `gg_check`, `ft_geom_defaults`, and `modern_geom_defaults`. Based on their names and README descriptions, these address narrower presentation and editing tasks. They are not a general chart-formatting framework. This is a deliberate boundary for reviewers: adopting hrbrthemes means adopting a collection of opinionated defaults, not obtaining automatic brand governance.
Fonts and the rendering dependency in hrbrthemes
The font aliases make theme configuration more explicit. Variables include `font_an` for Arial Narrow, `font_rc` and `font_rc_light` for Roboto Condensed, `font_ps` and `font_ps_light` for PlexSans, and corresponding aliases for Archivo, Econ Sans, and Public Sans. Bold, italic, light, semibold, and thin aliases are also listed for several families. Import helpers include `import_archivo`, `import_econ_sans`, `import_plex_sans`, and `import_roboto_condensed`.
This design exposes a real operational constraint. A theme can name a font that the current machine cannot render correctly. The resulting appearance may differ from the author's intended chart, especially in static export, PDF generation, or CI. The README specifically discusses Arial Narrow as broadly available, but it does not provide a cross-platform font fallback policy or a complete list of rendering requirements for every theme. The repository includes `inst/` and documentation directories, but the README does not state that all fonts are installed automatically.
For a team, the first rendering check should therefore occur on the actual output host. A notebook that looks correct locally is not sufficient evidence. If the team uses a container or centralized rendering service, that environment needs the selected font family installed. Without that check, the visual benefit of the theme can disappear into fallback text or inconsistent glyph spacing.
Installing hrbrthemes and making a first ggplot2 chart
The README gives a CRAN installation path and notes that the CRAN version is 0.9.3. This is the shortest supported installation route documented in the README. The `remotes` route is also documented for the original repository and for a Codeberg repository, but the README does not explain the remaining prerequisites for the `remotes` options.
Run this in an R session to install the CRAN package. The package should appear in the installed package library; the exact console output depends on the R environment.
install.packages("hrbrthemes")After installation, use the documented theme and scale names in an existing ggplot2 chart. For a first plot, apply `theme_ipsum()` for the core Arial Narrow treatment, then add `scale_x_percent()` or `scale_y_percent()` when the relevant axis represents percentages. For categorical color or fill, the README lists `scale_color_ipsum`, `scale_colour_ipsum`, and `scale_fill_ipsum`.
The README does not show a complete plot script, so it does not document required arguments for the theme or scale functions. Keep the first test small: plot one variable, add the theme, then add only the scale needed for that axis. This makes it easier to identify whether an issue comes from theme settings, scale formatting, font availability, or the underlying ggplot2 layer.
Palette choices and ggplot2 compatibility limits
hrbrthemes includes `ipsum_pal`, `ft_cols`, `ft_pal`, `ft_text_col`, `bit12`, and `bit12_extended`. The README describes `bit12` as a vector of 12 vibrant colors for categorical data and `bit12_extended` as 12 palettes with nine shades for continuous interpolation. Flexoki objects provide light, dark, and extended variants, with corresponding fill scales for discrete, continuous, distiller, and spectrum use.
This is a broader color system than a single theme needs. It gives developers several choices, but it also means the package is opinionated at the design level. A muted ipsum palette, a bright FT palette, Bit12, and Flexoki do not represent neutral infrastructure. They encode choices about contrast and visual identity. Teams with an existing accessibility standard or brand palette should review color contrast and output behavior rather than adopting a palette solely because its scale function is available.
Compared with using ggplot2's built-in `theme_minimal()`, `theme_bw()`, or default color and scale systems directly, hrbrthemes offers a faster path to a specific editorial appearance. That is its real alternative: no additional theme package is needed when the project's default ggplot2 styling is already acceptable. The trade-off is less neutrality and more dependency on the package's maintenance, font assumptions, and release compatibility.
Maintenance, releases, and the custom licence classification
The repository is not archived, and the last push was on 2026-10-10. However, the listed releases are relatively infrequent: `v0.5.0` on 2018-04-30, `v0.6.0` on 2019-01-21, and `0.8.0` on 2020-03-05. The README also notes that the CRAN version is 0.9.3. These dates show recent repository activity but do not by themselves establish compatibility with a specific future ggplot2 release.
Upgrade cost depends on how central hrbrthemes becomes. If one script calls `theme_ipsum()`, replacing the theme is local. If a reporting system standardizes on the package's palettes, scale names, font aliases, and geom-default utilities, upgrades require checking chart output across many templates. The repository includes `tests/`, `NEWS.md`, and package documentation, but the README does not describe a compatibility matrix or a formal migration policy.
The license metadata is also unresolved. The repository metadata labels the license as Other and points to the `LICENSE` file, while the README includes an MIT badge. That discrepancy should be checked against the actual `LICENSE` file and organizational policy before redistribution or internal use. This is a documentation and governance issue, not legal advice.
Editorial conclusion
Adopt hrbrthemes when a team already works in R and ggplot2 and wants a shared typographic chart style without building every theme setting and palette internally. Do not adopt it for a publication that requires guaranteed font availability across unmanaged systems, or when an unclassified custom licence conflicts with your organization's approved licence list. Verify the exact `LICENSE` file, the installed font files on each rendering host, and a representative chart rendered through the same output path used for delivery before standardizing on the package.
Frequently asked questions
How do I install hrbrthemes for R?
The README documents `install.packages("hrbrthemes")` for a CRAN installation and says that the CRAN version is 0.9.3. It also lists installation through `remotes::install_git()` for the original repository and a Codeberg repository.
Which ggplot2 theme does hrbrthemes provide?
The core theme is `theme_ipsum`, which the README describes as using Arial Narrow. Additional themes cover Archivo, Econ Sans, Goldman Sans, IBM Plex Sans, Public Sans, Roboto Condensed, and Titilium Web.
Does hrbrthemes require fonts to be installed separately?
The README documents font import helpers such as `import_archivo`, `import_econ_sans`, `import_plex_sans`, and `import_roboto_condensed`, but it does not state that every theme font is installed automatically. The selected font should be checked on the machine or service that renders the chart.
What alternatives does hrbrthemes provide to standard ggplot2 styling?
Instead of starting with ggplot2's built-in themes and scales, users can apply `theme_ipsum()` and matching ipsum, FT, Bit12, or Flexoki scales. This trades default neutrality for a more opinionated typographic and color treatment.
Is hrbrthemes actively maintained?
The repository is not archived and its last push was on 2026-10-10. The latest listed release is 0.8.0 from 2020-03-05, while the README identifies the CRAN version as 0.9.3.
What licence applies to hrbrthemes?
The repository metadata labels the licence as Other and points to the `LICENSE` file. The README also displays an MIT badge, so the actual `LICENSE` file should be reviewed before use or redistribution.
Official sources
Add this badge to your README
If you maintain this project, the badge below links readers to this analysis and shows its maintenance status from the daily GitHub snapshot. Paste the markdown into your README; add ?metric=license or ?metric=stars to the image URL for a different field.

[](https://hysenlabs.com/projects/hrbrmstr-hrbrthemes)Star history chart for your README
[](https://hysenlabs.com/projects/hrbrmstr-hrbrthemes)Was this useful?