speedscope: a browser-based viewer for CPU profiles from Chrome, py-spy, perf and pprof
🔬 A fast, interactive web-based viewer for performance profiles.
At a glance
- What is it?
- speedscope turns profiling output from many languages into an interactive flamegraph in the browser, with three views that answer different questions. The trade-off is that it only reads files; it does not collect the profile for you.
- Who is it for?
- Adopt speedscope if you already have profile files and want to read them without uploading them anywhere. Skip it if you need a profiler that captures data, and check whether a diff between two profiles is supported if you need one.
- Can I use it commercially?
- Yes. MIT is a permissive licence: you can use, modify and sell software built on it, as long as you keep its copyright and licence notices.
- Is it still maintained?
- Activity is slowing. The repository last received commits 6 months ago.
- What is it written in?
- Mainly TypeScript, according to GitHub's language statistics.
Answers come from the project's GitHub data, last synced on November 21, 2026, and from our analysis. They are not legal advice.
Star history
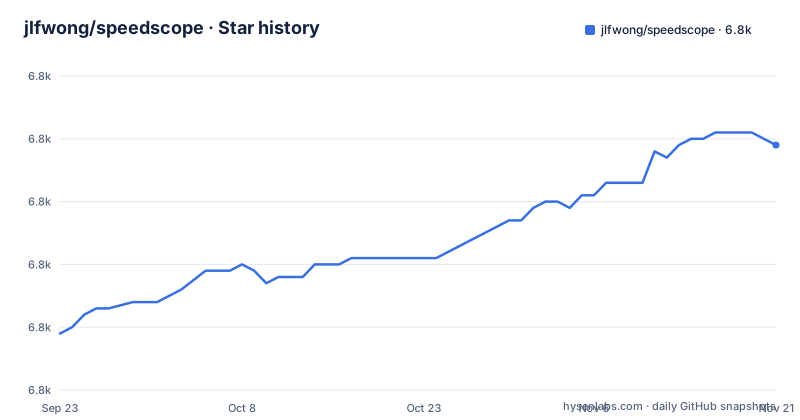
- jlfwong/speedscope6,789 ★ · +30
| Repository | 2026-09-23 | 2026-11-21 |
|---|---|---|
| jlfwong/speedscope | 6.8k | 6.8k |
30 Stars in the last 59 days, measured from the daily GitHub snapshot. Compare with other projects
Editorial analysis
What speedscope solves, and who it is for
Profilers emit files in whatever format their authors chose. A Chrome tracing export, a py-spy dump, a Go pprof profile and a perf.data conversion have almost nothing in common on disk, and reading them usually means a terminal tool or a spreadsheet. speedscope takes that raw profiling data and renders it as an interactive view so you can see what is slow, what is allocating memory, or whatever the profile actually measures. The README frames the goal that way: given raw profiling data, the tool lets you explore it interactively.
The audience is anyone who already owns a profile file and needs to read it. Backend engineers chasing a latency spike in a Go service, Python developers with a py-spy capture, frontend engineers with a Chrome performance recording, Ruby developers with stackprof or rbspy output. The supported-source list in the README spans JavaScript, Ruby, Python, PHP, Go, Rust, Java, Erlang and Elixir, native code through Instruments.app and perf, plus .NET Core, GHC and custom sources. That breadth is the product. A single viewer that accepts all of those is more useful than a viewer that is marginally better at one format.
It is not a profiler. Nothing in the repository samples a running process. You bring the file.
The three views and what each one answers
speedscope splits the screen into a minimap on top and a stack view below. The minimap gives you the whole profile at a glance; the stack view is where you read detail. The horizontal axis is the weight of each stack, most commonly CPU time, and the vertical axis is the stack that was active at the time of the sample.
Time Order is the default. Stacks are laid out left to right in the order they appear in the input file, which is usually chronological. This is the view for questions about sequence: first the data is fetched from the database, then it is prepared for serialization, then it is serialized to JSON. If you care about what happened before what, this is the only view that preserves that.
Left Heavy groups identical stacks regardless of when they were recorded, then sorts so the heaviest stack under each parent sits on the left. When hundreds or thousands of calls are interleaved, Time Order turns into visual noise and Left Heavy is the one that shows where the time actually accumulates.
Sandwich is a table of functions with self time and total time, sortable by either. Selecting a row shows flamegraphs for all callers and all callees of that function. That is the fastest route from "this function is hot" to "who calls it and what does it call", and it is the view most people end up using once they know the profile is worth reading.
Navigation is worth learning. Scroll pans on either axis, Cmd+scroll zooms, double click fits the viewport to a frame, and single click shows summary statistics for a frame. The keyboard shortcuts are plus and minus to zoom, 0 to fit the whole profile, w/a/s/d or the arrow keys to pan, and 1, 2 and 3 to switch to Time Order, Left Heavy and Sandwich.
Installing speedscope and loading a first profile
There are three ways in, and which one you pick depends on whether you have Node installed and whether the machine has network access.
The hosted app at https://www.speedscope.app needs nothing. Open it, then browse to a profile file or drag one onto the page. The README states the profiles are not uploaded anywhere and the application is entirely in-browser, so a capture from a production machine does not leave your laptop.
For terminal convenience, install the npm package globally. The bin entry in package.json maps the speedscope command to ./bin/cli.mjs.
npm install -g speedscopeThen point it at a file. Invoking the command with a path loads speedscope in your default browser.
speedscope /path/to/profileIf you have neither npm nor Node, download the self-contained zip from the releases page, unzip it, and open the contained index.html in Chrome or Firefox. That build is what you want on an air-gapped machine or a locked-down workstation.
There is also a URL import path. Appending a hash fragment of the form #profileURL=[URL-encoded profile URL]&title=[URL-encoded custom title] loads a specific profile by URL. The README notes the server hosting the profile must have CORS configured to allow AJAX requests from speedscope, so this only works when you control the host or it already permits the origin.
After loading, you should see the minimap and stack view split, with Time Order selected. Click a frame to see its summary statistics before you change anything else.
Where speedscope is the wrong tool
The clearest limitation is the one stated by omission: speedscope reads profiles, it does not produce them. There is no sampling agent, no attach-to-process mode, no daemon. If your problem is "I do not have a profile yet", you need py-spy, perf, pprof, stackprof or the equivalent in your language, and speedscope is the second step.
Comparing two profiles, before and after a change, is a common need; if your workflow depends on that, verify it exists before committing to the tool.
The URL import path has a real constraint rather than a soft one. The hash fragment only works when the profile's host sends the right CORS headers. A profile sitting on an internal file server that does not allow cross-origin AJAX will not load this way, and the fallback is downloading the file and dragging it in.
The browser target is narrow by design. The browserslist field in package.json lists the last two Chrome versions and the last two Firefox versions. Safari is a supported import source, but the app's own browser support list does not include it. Check that against your team's default browser before assuming it will run everywhere.
Finally, the tool is a viewer. It shows you where weight sits; it does not tell you why a function is slow, and it cannot distinguish a hot loop from a function that is simply called a very large number of times without you reading the callers.
speedscope against flamegraph.pl and other viewers
The obvious comparison is Brendan Gregg's FlameGraph, which the README links to directly. flamegraph.pl is a Perl script that consumes folded stacks and emits an SVG. The output is a static image: one view, one layout, no zooming beyond what the SVG viewer provides, no table of functions sorted by self time, no way to select a function and see its callers and callees side by side. It is fast, it works over SSH, and it drops into a CI artifact directory without a browser.
speedscope inverts those properties. You get three views, interactive navigation, summary statistics per frame and the Sandwich table, but you need a browser and a rendered page rather than a file you can grep. For a one-off look at a profile on a remote box, flamegraph.pl is less friction. For actually reading a profile you intend to act on, the interactive views do work that a static SVG cannot.
The README's import list also names pyspeedscope for Python, flamescope for Rust and eflambe for Erlang and Elixir, but it lists them as ways to get profiles into speedscope, not as alternative viewers. If your language has a dedicated viewer that you already know, the honest question is whether the breadth of speedscope's import support matters to you. If you profile in one language only, it may not.
One more difference worth naming: the hosted app means no installation at all, which flamegraph.pl cannot offer and language-specific viewers generally cannot either.
Maintenance, licence and what upgrading costs
The repository is not archived. The last push was on 2026-05-15, and the most recent release listed is v1.25.0 from 2025-12-03, following v1.24.0 and v1.23.2 in October 2025. Upgrades are not a treadmill: the tool reads files, it does not hold state, and there is no server to migrate. A new release changes what you can view, not what you have to maintain.
The cost of upgrading is mostly the cost of rebuilding if you self-host. The package.json scripts show the shape of that: prepack runs a script into dist/release, which is what the npm package's files list ships. If you use the hosted app or the npm package, this is not your problem.
The licence is MIT. That permits commercial and internal use, modification and redistribution, subject to the usual condition that the copyright notice and permission notice are included. This is a description of the licence text, not legal advice; if you are redistributing a modified build inside a product, have your own counsel read the LICENSE file.
One operational note: README-ADMINS.md sits at the top level of the repository, so read that file directly if you maintain your own copy of speedscope.
Editorial conclusion
Adopt speedscope if you already have profile files and want to read them without uploading them anywhere. Skip it if you need a profiler that captures data, and check whether a diff between two profiles is supported if you need one. Before relying on it, confirm the import path for your toolchain from the wiki page for your profiler, and check the release assets if you plan to use the offline build.
Frequently asked questions
How do I use speedscope?
Either open https://www.speedscope.app and drag a profile file onto the page, or install the npm package and run speedscope /path/to/profile to open it in your default browser. There is also a self-contained zip on the releases page whose index.html you can open directly in Chrome or Firefox.
How does speedscope compare to flamegraph?
FlameGraph's flamegraph.pl turns folded stacks into a static SVG, while speedscope renders an interactive page with three views: Time Order, Left Heavy and Sandwich. The README links to FlameGraph as prior art, and the difference is interactivity and the function table rather than the underlying stack representation.
Can I install speedscope with npm?
Yes. The README gives npm install -g speedscope, and package.json maps the speedscope command to ./bin/cli.mjs. Running speedscope with a profile path loads the viewer in your default browser.
Does speedscope upload my profile data?
The README states the profiles are not uploaded anywhere and the application is totally in-browser. That applies to the hosted app and to the local install alike.
What profile formats does speedscope support?
The README lists import paths for JavaScript (Chrome, Firefox, Safari, Node.js, Hermes), Ruby (stackprof, rbspy, ruby-prof), Python (py-spy, Austin, pyinstrument), PHP, Go pprof, Rust, Java, Erlang and Elixir, native code via Instruments.app and perf, plus .NET Core, GHC and custom sources.
Can I load a profile by URL in speedscope?
Yes, by appending a hash fragment of the form #profileURL=[URL-encoded profile URL]&title=[URL-encoded custom title]. The README notes the server hosting the profile must have CORS configured to allow AJAX requests from speedscope, so hosts without those headers will not work.
Official sources
Add this badge to your README
If you maintain this project, the badge below links readers to this analysis and shows its maintenance status from the daily GitHub snapshot. Paste the markdown into your README; add ?metric=license or ?metric=stars to the image URL for a different field.

[](https://hysenlabs.com/projects/jlfwong-speedscope)Star history chart for your README
[](https://hysenlabs.com/projects/jlfwong-speedscope)Was this useful?