Kamon Telemetry for JVM tracing and metrics
Distributed Tracing, Metrics and Context Propagation for applications running on the JVM
At a glance
- What is it?
- Kamon Telemetry is a Scala-centered library set for JVM applications that need metrics, context propagation, and distributed traces. Its README sends developers to external installation guides instead of documenting setup in the repository.
- Who is it for?
- Kamon Telemetry fits JVM teams that want metrics, context propagation, and distributed tracing through a coordinated library set and can follow Kamon's external setup documentation. It is a poor fit for developers who need a self-contained quick start or confirmed OpenTelemetry integration details.
- Can I use it commercially?
- Check first. The repository uses a licence we do not classify automatically, so read its LICENSE file before any commercial use.
- Is it still maintained?
- Yes. The repository last received commits 66 days ago.
- What is it written in?
- Mainly Scala, according to GitHub's language statistics.
Answers come from the project's GitHub data, last synced on November 6, 2026, and from our analysis. They are not legal advice.
Star history
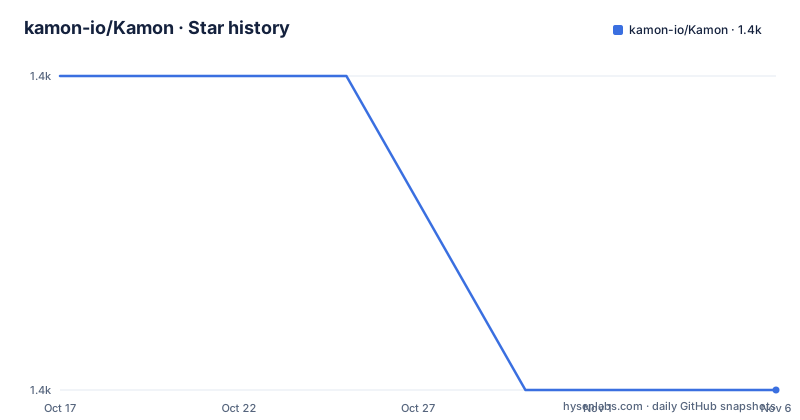
- kamon-io/Kamon1,426 ★ · -1
| Repository | 2026-10-17 | 2026-11-06 |
|---|---|---|
| kamon-io/Kamon | 1.4k | 1.4k |
-1 Stars in the last 20 days, measured from the daily GitHub snapshot. Compare with other projects
Editorial analysis
Kamon Telemetry's JVM instrumentation scope
Kamon Telemetry addresses application-level observability in applications running on the JVM. According to the README, its libraries collect metrics, propagate context across threads and services, and obtain distributed traces automatically. This makes the project relevant to developers and platform teams instrumenting JVM services that need metrics and distributed context without implementing each measurement and propagation path as unrelated application code.
The repository presents Kamon as a set of libraries, not as a complete observability backend. The README does not identify a metrics database, trace storage system, dashboard, alerting service, or long-term data repository. The repository does contain a `reporters/` directory, but the available documentation does not list supported destinations or explain whether a reporter is included by default. Reading Kamon's external guides is therefore necessary when matching the library to an existing telemetry system.
The primary language is Scala, while the stated runtime scope is the JVM. This does not mean every Kamon user must have a Scala codebase. The README does not state which Scala versions, Java versions, or JVM application types are supported, however, so that compatibility remains a separate question. A Java team should not infer support merely from the JVM scope. It should confirm the relevant artifacts and supported runtime configuration before adding Kamon to a build.
Kamon's practical appeal lies in putting several instrumentation concerns in one library set. The approach reduces the need to design thread propagation, service propagation, metrics collection, and distributed tracing separately in every application. It also creates a dependency on Kamon's module structure and version compatibility. For an organization, the central decision is whether that common library layer is preferable to maintaining instrumentation independently in each service.
Context propagation across Kamon's JVM boundary
The clearest documented mechanism is context propagation across threads and services. Thread propagation concerns work that changes execution context inside a JVM. Service propagation concerns context carried beyond an application boundary. Kamon states that its libraries handle both forms and can produce distributed traces automatically, but the README does not name a wire format, carrier header, context identifier, serialization rule, or sampling setting.
That missing detail has direct consequences for adoption. Teams need to know whether their existing service boundary can carry Kamon's context and whether downstream systems are expected to participate in the same trace. The README does not answer those questions. It also does not explain how traces leave the JVM, where they are stored, or how a trace can be correlated with metrics. Automatic tracing should therefore be treated as a documented capability, while its implementation and backend contract still require verification.
Metrics collection is documented alongside tracing, but no API example appears. The README does not provide a metric type, recorder name, registry, tag definition, exporter setting, or output format. Consequently, this article cannot verify how a first metric is declared or what output a reader should see. The official installation guides are the authoritative next source for setup instructions, while the module code would need direct inspection for API-level details.
The `otel` repository topic indicates an OpenTelemetry association, but the README does not explain it. That topic alone is insufficient to claim that Kamon exports through OpenTelemetry, embeds the OpenTelemetry SDK, implements a particular bridge, or replaces another tracing implementation. Teams that require a specific OpenTelemetry workflow need that relationship confirmed in Kamon's external documentation before adoption.
Core, instrumentation, bundle, and reporter modules
Based on the repository layout, Kamon is split across several source areas: `core/`, `instrumentation/`, `bundle/`, and `reporters/`. This organization suggests separate responsibilities for foundational behavior, application integrations, grouped artifacts, and output components. The names alone do not define package contents, dependency boundaries, or which modules a new application should use.
The top-level `build.sbt` file indicates an sbt-based multi-module project. The `project/` directory further supports that structure. However, the README does not include a module dependency graph, published artifact table, Scala compatibility matrix, or Java support policy. A team should not choose a module solely because its directory name appears to match its framework. It needs the module identifier and dependency instructions from Kamon's official setup documentation.
The Maven Central badge in the README references `io.kamon:kamon-core_2.13`. That confirms a published coordinate carrying the `_2.13` suffix, but it does not establish that this coordinate is suitable for every application. It also does not show whether other Scala binary versions are available. Java users may still need a Scala artifact as an underlying dependency, but the README does not explain how to select one. The correct coordinate and integration path must be confirmed for the application's build.
The split into instrumentation and reporters also raises a coupling question that the README leaves unanswered. A service might use one instrumentation module and require a separate reporter, or it might use a bundle that groups several pieces. The repository layout makes both possibilities plausible, but it does not prove either workflow. Reviewing the relevant build definition and official installation guide is the first concrete step before committing to a dependency graph.
Installing Kamon and reaching a first telemetry event
The README does not contain installation commands, dependency declarations, configuration snippets, initialization code, or a first runnable example. Its only explicit setup instruction is to follow the installation guides linked from `https://kamon.io/get-started/`.
The documented first-use process begins by opening Kamon's installation guide. From that page, select the guide corresponding to the application and instrumentation being used. Add the dependencies named there, apply the documented configuration, and use the documented initialization or instrumentation path. The README does not identify which configuration keys exist, whether initialization is automatic, or which signal should appear after the application starts. Those details must come from the guide rather than assumptions.
A first verification should follow the external guide's own procedure. The repository excerpt supplies no endpoint, console message, trace ID, metric name, dashboard, or expected log line. This absence matters because successful installation cannot be described as successful telemetry export until the application has emitted a signal and the receiving environment has displayed it according to Kamon's documentation.
For teams already familiar with JVM builds, the likely work is selecting the correct published artifact and adding its supported integration. The repository itself does not establish which build declarations are valid for sbt, Maven, Gradle, or another build system. The Maven Central badge is evidence of publication, not a complete installation guide. Follow the linked guide rather than reconstructing a dependency tree from the directory names.
A good first-use review should record four concrete items: the selected artifact, the Scala or Java compatibility statement, the reporter or backend configuration, and the documented way to confirm telemetry. If the guide does not address one of these for the target service, that gap must be resolved before standardizing Kamon across the application portfolio.
Kamon versus application-owned instrumentation
A real alternative is to implement metrics and tracing directly with application-specific frameworks or shared internal libraries. In that model, each service defines its own metric names and dimensions, request identifiers, thread handoff rules, and service propagation format. Distributed tracing may also be connected through a separately managed telemetry SDK or exporter. This approach gives the organization direct control over its conventions, but it requires maintaining those conventions in application code and shared libraries.
Kamon uses a different approach. It packages metrics collection, context propagation across threads and services, and automatic distributed tracing as a library set. An adopting service supplies application instrumentation while Kamon handles common telemetry behavior within the documented scope. The benefit is less duplicated plumbing. The cost is dependency on Kamon's module choices, compatibility, release upgrades, and external setup documentation.
Framework-specific instrumentation is another partial alternative when the application stack is narrow and its framework already provides tracing and metrics facilities. Kamon may cover cross-cutting propagation beyond one framework, but the README does not enumerate its supported integrations. It therefore does not establish whether it duplicates, complements, or replaces an existing framework tracer. Teams should compare propagation formats, configuration ownership, and backend compatibility before combining both systems.
There is no verified performance comparison, adoption claim, or migration cost in the README. The decision should not rest on generic statements about flexibility. It should turn on concrete repository and deployment questions: which modules the service needs, whether Kamon fits the existing telemetry backend, how context crosses current service boundaries, and how upgrades affect instrumentation across the fleet.
Kamon releases, maintenance, and license verification
The repository is not archived, and the last push was on 2026-09-03. Recent releases include `v2.8.1` on 2026-01-19, labeled as minor fixes, and `v2.8.0` on 2025-12-02, whose release description states that it upgrades to Kanela 2.0. The release history indicates recent maintenance activity, but it does not provide a detailed compatibility policy or migration guide in the README excerpt.
The Kanela 2.0 transition deserves attention during upgrades. Kanela is not explained in the README, so users cannot determine from that page which integrations it affects or whether configuration changes are required. Before upgrading an application, review the release notes for the relevant Kamon version and inspect the exact modules in the build. This is especially relevant in a multi-service environment where different applications may not use the same instrumentation or reporter set.
License presentation also needs direct verification. The README says Kamon is licensed under the Apache License, Version 2.0 and includes the Apache License text. GitHub's repository classification instead says that the license is a custom license it cannot classify. The repository also contains a `LICENSE` file. An organization should inspect that file and have its compliance process review the applicable notices. This article does not provide legal advice or assume which classification controls for a particular use.
Upgrade cost is therefore tied to more than changing one version number. Teams may need to inspect Kanela compatibility, reconcile the artifact used by each module, validate context propagation in threaded and cross-service paths, and confirm that telemetry still reaches the selected reporter. The release record supports an upgrade-review step, but it does not establish how disruptive that process will be for a particular application.
Editorial conclusion
Kamon Telemetry fits JVM teams that want metrics, context propagation, and distributed tracing through a coordinated library set and can follow Kamon's external setup documentation. It is a poor fit for developers who need a self-contained quick start or confirmed OpenTelemetry integration details. Before adoption, verify the module for the target application, check compatibility with its Scala and build configuration, and inspect the LICENSE file because its presentation differs between the README and GitHub's classification.
Frequently asked questions
What is Kamon Telemetry used for?
It is a set of libraries for JVM applications that collect metrics, propagate context across threads and services, and obtain distributed traces automatically.
How do I install Kamon Telemetry?
The README directs developers to the installation guides at `https://kamon.io/get-started/`. It does not contain dependency declarations, initialization code, or a runnable first example.
Does Kamon Telemetry include a dashboard or trace database?
The README describes application instrumentation libraries and does not identify a dashboard, trace database, metrics database, or alerting service. It includes a `reporters/` repository directory but does not list its supported destinations.
Is Kamon Telemetry licensed under Apache License 2.0?
The README states Apache License 2.0, while GitHub's repository classification says it cannot categorize the license as a known standard license. The repository's `LICENSE` file should be reviewed directly for compliance purposes.
Official sources
Add this badge to your README
If you maintain this project, the badge below links readers to this analysis and shows its maintenance status from the daily GitHub snapshot. Paste the markdown into your README; add ?metric=license or ?metric=stars to the image URL for a different field.

[](https://hysenlabs.com/projects/kamon-io-kamon)Star history chart for your README
[](https://hysenlabs.com/projects/kamon-io-kamon)Was this useful?