Latitude: Trace-Level Observability That Hands Failures to Your Coding Agent
Open-source observability for AI agents. Find where your agents fail, dispatch your coding agent to fix it, and verify the fix against real traces.
At a glance
- What is it?
- Latitude is a TypeScript-first observability stack for AI agents that groups failing traces into tracked signals, then dispatches Claude Code or Cursor to open a fix PR and replays the fix against the original traces. The interesting part is the closed loop; the part to scrutinise is how much of that loop is code you can inspect versus service you have to trust.
- Who is it for?
- Adopt Latitude if your agent already runs in TypeScript or Python, you can point an OpenTelemetry exporter at it, and you want failing traces turned into tracked signals rather than a dashboard you have to read manually. Do not adopt it if your agent is not instrumentable at the SDK level.
- Can I use it commercially?
- Yes. MIT is a permissive licence: you can use, modify and sell software built on it, as long as you keep its copyright and licence notices.
- Is it still maintained?
- Yes. The repository last received commits 1 day ago.
- What is it written in?
- Mainly TypeScript, according to GitHub's language statistics.
Answers come from the project's GitHub data, last synced on November 15, 2026, and from our analysis. They are not legal advice.
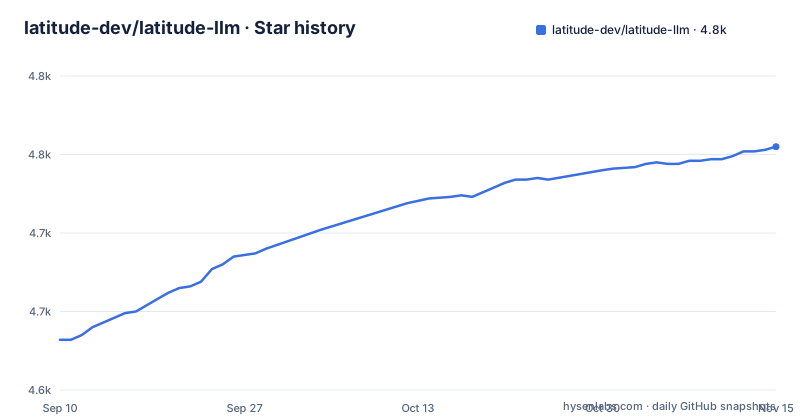
Star history
- latitude-dev/latitude-llm4,755 ★ · +123
| Repository | 2026-09-10 | 2026-11-15 |
|---|---|---|
| latitude-dev/latitude-llm | 4.6k | 4.8k |
123 Stars in the last 66 days, measured from the daily GitHub snapshot. Compare with other projects
Editorial analysis
The gap Latitude is trying to close: traces nobody acts on
Most agent observability tools stop at the trace viewer. You get spans for each model call, tool invocation and turn, and then a human has to read them, decide which failures matter, and write a fix by hand. The README frames Latitude's pitch as four steps: observe, understand, fix, verify. The observe step is ordinary telemetry. The understand step groups failing traces into what the documentation calls signals, each carrying status, size and trend, so you can see which failure class is growing rather than scrolling individual traces. The fix step is the unusual one: Latitude dispatches a coding agent (the README names Claude Code and Cursor) with the failing traces as context and a deep link back into the product, and that agent opens a pull request. The verify step replays the fix against the original failing traces using regression datasets.
The target user is a team already shipping an agent to production, with enough traffic that failures recur in patterns rather than as one-offs. If you have ten traces a day, grouping them into signals adds ceremony without insight. If you have thousands, the manual triage loop is the actual bottleneck, and that is the loop this project is aimed at.
How the telemetry actually gets in: instrumentation wrappers, not a proxy
The TypeScript SDK is installed as @latitude-data/telemetry and constructed with an apiKey, a project slug, and an instrumentations object that maps a provider class to itself. In the README example that is instrumentations: { openai: OpenAI }. You then use the provider's own client normally, and call latitude.shutdown() when the process exits.
Because it is built around OpenTelemetry, the README states that Python and any OpenTelemetry-compatible runtime are supported, and there is an OTel exporter path documented separately. That matters for polyglot stacks: you do not need every service to adopt the TypeScript SDK. The README also mentions capture() for marking request, conversation or agent boundaries when you want to attach user IDs, session IDs, tags or metadata. That is the mechanism for turning a bag of spans into a session you can filter on later.
Signals, flaggers and behaviours: the grouping layer
The understand step is where Latitude diverges from a plain trace store. Failing traces are auto-grouped into signals, and the README links to separate documentation for flaggers, behaviours, semantic search and annotations. The naming suggests a pipeline: flaggers decide what counts as a failure, signals aggregate those failures into tracked units, and behaviours plus semantic search let you query across them in natural language rather than by exact span attributes.
The design bet here is that failure identity is a clustering problem, not a labelling problem. Traditional monitoring asks you to define an alert rule up front. Latitude's approach is to let the system propose groupings and then let you annotate and track them. That is more useful when you do not yet know what your failure modes are, which is the normal state for a new agent. It is less useful when you have a compliance requirement to alert on a specific, named condition, because a clustered signal is not a deterministic rule.
The clustering algorithm, the thresholds that separate one signal from another, and how a signal is retired when the underlying bug is fixed are the questions I would want answered before treating a signal count as a release gate.
Agent Dispatch is the differentiator, and the part with the most moving parts
Agent Dispatch takes a signal, assembles the context (sample traces plus a deep link), and hands it to a coding agent. The README lists Linear and webhook dispatch as alternative delivery routes alongside the direct Claude Code and Cursor path, and there is an MCP server so the same operations are reachable from inside a coding agent session. The CLI mirrors the UI, per the README's claim that everything in the UI is available from your coding agent via MCP and the CLI.
Two things follow from this architecture. First, the quality of the generated fix depends on the quality of the trace context, not on Latitude's own model. If your traces do not include the tool arguments or the retrieved documents that caused the bad output, the dispatched agent is guessing. Second, dispatch implies write access somewhere: a repository, a branch, a PR. Before wiring this into a production repository, establish whether the dispatched agent can push to a protected branch and what review gate sits between its PR and main.
The verify step is what makes the loop credible. Replaying a fix against the original failing traces via a regression dataset is a stronger claim than "the agent says it is fixed", and it is the reason the fix and verify halves belong in the same product rather than in two tools.
Getting it running: two paths, one of which is a prompt
The recommended path in the README is not a command. It is a prompt you paste into a coding agent: install the latitude-setup skill from github.com/latitude-dev/skills and use it to add tracing to the app. That is a deliberate choice, and it tells you who the project is built for. The manual path is npm install @latitude-data/telemetry, then constructing the Latitude client with process.env.LATITUDE_API_KEY and process.env.LATITUDE_PROJECT_SLUG, registering your provider in instrumentations, and calling await latitude.shutdown() at exit. Both environment variable names are load-bearing and appear in the README example verbatim.
For anything beyond the SDK, the README points at the Start tracing guide for provider and framework specifics, and lists OpenAI, Anthropic, Bedrock, Vercel AI SDK and LangChain as supported integrations. The README's self-host section says Latitude is self-hostable at any scale, with container images on Docker Hub, a single-host Docker Compose guide, a Kubernetes cluster deployment via a Helm chart, and a one-click Railway option.
The free tier is stated as 20K credits per month, 30-day data retention and unlimited seats. Retention is the number that matters for the verify step: a regression dataset built from traces older than your retention window is not reproducible on the hosted tier.
Where it is the wrong tool
Latitude assumes your agent is instrumentable at the SDK layer. If your agent is a closed third-party product, or a chain of services where you cannot add the telemetry package, the observe step has nothing to attach to. The OTel ingest path widens this somewhat, but you still need spans that carry model and tool semantics, not just HTTP timings.
There is also a scale mismatch in both directions. Below a certain volume, the signal grouping has nothing to group and you are paying for a trace viewer. Above a certain volume, the cost model is credit-based, and the README's quick start does not state how a credit maps to a trace, a span, or a token. That makes spend hard to forecast from the README alone, and it is the kind of thing that only becomes visible after a traffic spike.
Finally, the dispatched-fix loop is a poor fit for teams without review capacity. An agent that opens PRs against your agent codebase generates review work. If nobody is reading those PRs, you have added a queue, not a fix.
The honest alternative: raw OpenTelemetry plus your existing APM
The real comparison is not another LLM observability vendor. It is the path most teams are already on: emit OpenTelemetry spans from your agent, send them to whatever backend you already run (or a general-purpose tracing service), and write your own dashboards and alerts. Latitude itself speaks OTel, so this is not an either/or at the protocol level.
The difference is in what sits on top. A general-purpose backend gives you spans, queries and alert rules that you author. It does not group failures into signals, it does not dispatch a coding agent with trace context, and it does not replay a fix against the original failing traces. Conversely, a general-purpose backend does not impose a credit model, does not require your traces to leave your infrastructure if you run it yourself, and does not assume your failures are clusterable.
If your team already has strong tracing hygiene and a habit of writing regression tests from production failures, the incremental value of Latitude is mostly in the dispatch and replay steps. If you have neither, Latitude is buying you the grouping layer you have not built, at the cost of either a hosted dependency or a self-hosted stack you operate yourself.
Maintenance, release cadence and licence
The repository is active: the default branch is development, the last push is dated 2026-11-02, and recent releases include Latitude CLI v7.18.0, TypeScript SDK v9.17.0 and Python SDK v9.17.0, all on 2026-10-27. A major version of 9 on the TypeScript SDK is worth noting. It implies a history of breaking changes behind it, and it means you should pin the SDK version and read the changelog before upgrading rather than floating on a caret range.
The licence is MIT, per both the repository metadata and the README badge. MIT is permissive: you can use, modify and redistribute the code, including commercially, provided the copyright notice and permission notice are preserved. That covers the code in this repository. It does not automatically cover the hosted service at latitude.so, which the README treats as a separate product with its own free tier and its own terms. I am not giving legal advice here; if you are self-hosting and redistributing, read the LICENSE file in the repository and, if your organisation has one, route it past whoever handles open source compliance. The practical upgrade cost is the SDK major version plus whatever the Agent Dispatch integration requires when your repository layout or CI changes, since that integration lives outside the library.
Editorial conclusion
Adopt Latitude if your agent already runs in TypeScript or Python, you can point an OpenTelemetry exporter at it, and you want failing traces turned into tracked signals rather than a dashboard you have to read manually. Do not adopt it if your agent is not instrumentable at the SDK level. Before committing, verify three things in your own environment: that the self-host path in the repository actually covers the features you intend to use, that the Agent Dispatch flow can reach your repository and CI, and that the 30-day retention on the free tier matches how far back you need to replay regressions. The MIT licence covers the code in this repository; the hosted service at latitude.so is governed by separate terms.
Frequently asked questions
How do I add Latitude tracing to a TypeScript app?
Run `npm install @latitude-data/telemetry`, construct `new Latitude({ apiKey, project, instrumentations })` with your API key and project slug from the signup, then close with `await latitude.shutdown()`. Use `capture()` at request, conversation or agent boundaries to attach user IDs, session IDs, tags or metadata, and replace the OpenAI instrumentation with whichever LLM SDK your app already imports.
Which model providers does Latitude support?
Latitude is provider-agnostic and documents OpenAI, Anthropic, Bedrock, the Vercel AI SDK, LangChain and more, plus any OpenTelemetry-compatible application. Python is supported as well as TypeScript.
Does Latitude work with Claude Code sessions?
There is a dedicated package for it that captures full session transcripts as traces. Install it with `npx -y @latitude-data/claude-code-telemetry install`, and it works in the terminal, the Desktop app and the IDE extensions.
Can I self-host Latitude?
Yes, at any scale on fully open infrastructure, with three documented shapes: a single-host Docker Compose deployment, a Kubernetes cluster deployment through a Helm chart, and a one-click Railway template. Container images are published on Docker Hub, and `LAT_IMAGE_TAG` overrides the image tag that `docker-stack.yml` pulls.
What services does the repository's docker-compose.yml start?
The docker-compose.yml, which reads its settings from .env.${NODE_ENV:-development}, includes Postgres with pgvector started with `wal_level=logical`, ClickHouse, a general Redis plus a second Redis for BullMQ started with `--maxmemory-policy noeviction`, Mailpit for local mail, and Temporal with its UI for workflows. Application variables are prefixed `LAT_`, and the Postgres runtime user `latitude_app` is restricted and subject to row level security.
Is Latitude free to use?
The README states you can use it free, including 20K credits a month, 30 day data retention and unlimited seats. The source is MIT licensed, and self-hosting is offered separately for teams that need their own infrastructure.
Official sources
Add this badge to your README
If you maintain this project, the badge below links readers to this analysis and shows its maintenance status from the daily GitHub snapshot. Paste the markdown into your README; add ?metric=license or ?metric=stars to the image URL for a different field.

[](https://hysenlabs.com/projects/latitude-dev-latitude-llm)Star history chart for your README
[](https://hysenlabs.com/projects/latitude-dev-latitude-llm)Was this useful?