Excel for Data Analytics: the repository is the course workbook set
My 'Excel for Data Analytics' course on YouTube
At a glance
- What is it?
- The Excel_Data_Analytics_Course repository is not a library and not a tool. It is the set of Excel workbooks that accompany a free YouTube course, arranged in eight chapter directories, and it opens with a warning that downloading a single .xlsx file from GitHub can produce a file Excel refuses to open.
- Who is it for?
- The repository fits a learner working through the Excel for Data Analytics course who wants the practice files to match the lessons, and a teacher who wants a structured eight chapter set of spreadsheets to adapt. It does not fit anyone looking for an Excel automation library, since there is no code here, and it does not fit a workflow that pulls individual workbooks programmatically, because the project's own warning says individual downloads can be corrupted.
- Can I use it commercially?
- Not without permission. GitHub finds no licence file in the repository, and without a licence all rights are reserved by default: you may read the code but not reuse it. Check the README, or ask the authors, before using it.
- Is it still maintained?
- Yes. The repository last received commits 9 days ago.
- What is it written in?
- GitHub does not report a main language for this repository.
Answers come from the project's GitHub data, last synced on November 6, 2026, and from our analysis. They are not legal advice.
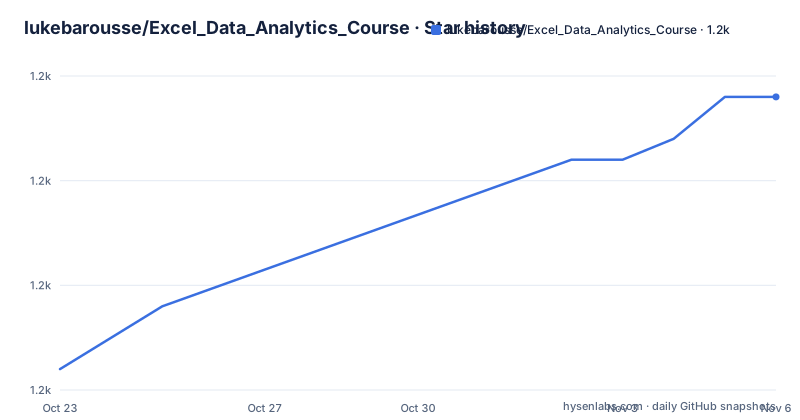
Star history
- lukebarousse/Excel_Data_Analytics_Course1,214 ★ · +13
| Repository | 2026-10-23 | 2026-11-06 |
|---|---|---|
| lukebarousse/Excel_Data_Analytics_Course | 1.2k | 1.2k |
13 Stars in the last 14 days, measured from the daily GitHub snapshot. Compare with other projects
Editorial analysis
A folder of spreadsheets, and a course attached to it
The repository describes itself plainly: it contains all the Excel files needed to follow along a free course called Excel for Data Analytics, which lives at lukebarousse.com/excel and has a video series linked from the README.
That framing matters, because the repository is regularly mistaken for a project. It is not a library, there is no package to install and no API to call, and the primary language is not even recorded. What it is, is the data side of a course: the workbooks the instructor opens on screen, laid out in a tree that mirrors the lesson plan.
The tree is the whole architecture. The top level holds the README, a .gitignore, and a 0_Resources/ directory, followed by eight numbered chapter directories from 1_Spreadsheets_Intro/ through 8_Power_Pivot/, and then two project directories, Project_1-Dashboard/ and Project_2-Analysis/.
The numbering is not decoration. It is a course index, and a file called something like 2_Formulas_Functions/ is a chapter you can navigate to on a video player and find the matching folder on disk. For a learner this means the repository is a table of contents, and for anyone teaching the same material it is a set of files that can be renamed and reused without re-deriving the structure.
The repository is not archived, the last push was on 2026-09-09, there are no GitHub releases, and the licence is not stated in the metadata, so the terms for reuse are whatever the file headers say.
The download warning is the first practical thing to know
The README has a section on downloading the Excel files, and the known issue it describes is the kind that wastes an afternoon.
If you download individual.xlsx files from GitHub, they can become corrupted and will not open in Excel.
The word can is doing a lot of work there, and it is the honest framing. The failure is intermittent, which means a user who downloads five files and gets one broken workbook is likely to blame the file rather than the delivery method.
Two workarounds are offered. The first is to download the whole repository by clicking Code and then Download ZIP at the top of the page, and the second is to use Google Drive instead, with a short link for the same files hosted there.
The Google Drive mirror is the more interesting of the two, and it exists for a reason the README does not spell out. An.xlsx is a ZIP archive of XML parts, and a file whose bytes arrive altered will not open in Excel. Downloading the whole repository as a zip is the path the README recommends, and the mirror hosts the same files on a different service.
For anyone automating this, the practical rule is to take the archive, not the individual files. The second project directory in the tree, and the chapter folders, are all workbooks, so a scripted course setup that fetches a list of raw URLs will eventually hit a file that Excel refuses to open, and the fix is in the download method rather than in the file.
Eight chapters, from ribbon to data model
The table of contents in the README is the course syllabus, and it is worth reading as a curriculum because it shows what the author thinks a working analyst needs in order.
Chapter 1, Spreadsheets Intro, covers worksheets, workbooks, the ribbon, the menu and keyboard shortcuts. Chapter 2, Formulas and Functions, is the longest, with logical, text, date, lookup, math and statistical functions as separate sections. Chapter 3 is charts: types, elements, styles, axes, layouts and templates.
Chapter 4, Spreadsheets Advanced, covers tables, conditional formatting, formatting and collaboration. Chapter 5 is pivot tables and pivot charts, plus an advanced section. Chapter 6 is Advanced Data Analysis, and it is the one that is really about the add-in world: analysis add-ins, Solver, Scenario Manager, Goal Seek and data tables.
Chapter 7 is Power Query, with the Power Query Editor, the M language and an advanced section. Chapter 8 is Power Pivot, covering DAX and data models.
The arc is the interesting part. It starts with the interface and the formula language, moves through presentation and structure, and only then reaches the two tools that change what a spreadsheet can do to a data source, which are Power Query for getting data in and Power Pivot for modelling it. That ordering is the same one a professional would argue for, and it explains why the later chapters are the ones where the workbooks are most worth having.
Two project folders that are not lessons
The last two directories in the tree are different in kind from the chapter folders, and the naming makes that clear.
Project_1-Dashboard/ and Project_2-Analysis/ sit after the numbered chapters, which means they are the two end-to-end pieces of work that the course builds towards rather than material for a specific lesson. A dashboard project and an analysis project are the two things an Excel course has to deliver to be worth taking, because they are what a job actually asks for, and they are also the hardest to teach because every choice has to be defended rather than demonstrated.
There is a companion directory, 0_Resources/, which holds the images used in the README and the course problem workbooks. The workbooks are described as the material for solving practice problems, and unlike the rest of the repository they are not free: the table of contents links to a purchase page on the same site as the course.
So the split is worth understanding before you start. The lesson workbooks are here, in the repository, free. The additional problems that turn watching into practice are a separate purchase, and the README is explicit about where they live and how to get them.
The people behind all of it are named as well, with the course leader, the course producer and the video editor, each with a profile link. For a free course that is a useful piece of information, because it tells you who to ask if a chapter is unclear and who to thank if it was useful.
Contributing means fixing a file, not filing an issue
The contribution path is short, and it says something about what kind of repository this is.
If you find an error in the repository, you are invited to make a pull request by forking the repository, making the change and submitting the pull request. There is no mention of an issue tracker, no code review process, no changelog and no release process, because there is no code to review and no artefact to release.
That is the honest shape of a course repository. The material is a spreadsheet, and a spreadsheet is either right or it has a typo in a cell, and the fastest way to fix the second case is to edit the file and send it. The other half of the contribution path is the fact that the practice workbooks are a paid product, which means the files in the repository are the marketing as much as the course, and a pull request that fixes an error in a lesson file is genuinely useful to the next thousand learners.
There is a subtlety worth noting about how a spreadsheet repository ages. The lesson content is tied to a version of Excel and to a set of videos, and when the course is re-recorded the workbooks are reorganised, renamed and re-saved. The directory numbering is the stable contract, because it is what the video chapters refer to, and the individual file names inside a chapter directory are the part most likely to change under you.
If you are following the course, the same directory names on the video and on disk are what let you jump to the file the instructor is opening, and if you are automating anything across the course, that naming is the only stable key you have.
Editorial conclusion
The repository fits a learner working through the Excel for Data Analytics course who wants the practice files to match the lessons, and a teacher who wants a structured eight chapter set of spreadsheets to adapt. It does not fit anyone looking for an Excel automation library, since there is no code here, and it does not fit a workflow that pulls individual workbooks programmatically, because the project's own warning says individual downloads can be corrupted. Verify three things before you rely on it: that you download the whole repository as a zip or take the Google Drive mirror rather than clicking single files, that the chapter directories match the videos you are actually watching, since the workbooks are reorganised between course versions, and that the practice problem workbooks, which are a separate purchase, are something you need at all, because the repository itself only contains the files used in the lessons.
Frequently asked questions
What is in the Excel for Data Analytics repository?
It contains the Excel files needed to follow along the free Excel for Data Analytics course, arranged in eight numbered chapter directories from 1_Spreadsheets_Intro/ to 8_Power_Pivot/, plus a 0_Resources/ directory with images and the problem workbooks, and two project directories, Project_1-Dashboard/ and Project_2-Analysis/.
Why do the Excel files fail to open when downloaded individually?
The README documents this as a known issue: individual .xlsx files downloaded from GitHub can become corrupted and will not open in Excel. The workarounds are to download the whole repository as a ZIP using the Code menu, or to take the files from the Google Drive mirror linked in the README.
What topics does the Excel for Data Analytics course cover?
Eight chapters: spreadsheets introduction, formulas and functions including logical, text, date, lookup, math and statistical functions, charts, advanced spreadsheet features, pivot tables and pivot charts, advanced data analysis with Solver, Goal Seek, Scenario Manager and data tables, Power Query with the M language, and Power Pivot with DAX and data models.
Are the practice problem workbooks free?
No. The workbooks for solving practice problems are in the 0_Resources/Problems/ directory and are linked for purchase on the course site. The lesson files in the chapter directories are free, and the repository covers the files used in the videos.
How do I contribute to the course repository?
The README asks you to fork the repository, make any changes and submit a pull request if you find an error. There is no issue tracker or release process, since the content is spreadsheets rather than code, and the repository has no GitHub releases.
Official sources
Add this badge to your README
If you maintain this project, the badge below links readers to this analysis and shows its maintenance status from the daily GitHub snapshot. Paste the markdown into your README; add ?metric=license or ?metric=stars to the image URL for a different field.

[](https://hysenlabs.com/projects/lukebarousse-excel-data-analytics-course)Star history chart for your README
[](https://hysenlabs.com/projects/lukebarousse-excel-data-analytics-course)Was this useful?