What vscode-js-debug actually does for Node, Chrome and WASM
A DAP-compatible JavaScript debugger. Used in VS Code, VS, + more
At a glance
- What is it?
- js-debug is the MIT licensed Debug Adapter Protocol implementation that ships as the default JavaScript debugger in VS Code and Visual Studio. It covers Node.js, Chrome, workers and WebAssembly with little configuration, and it is also usable as a standalone server in other editors.
- Who is it for?
- js-debug is the right choice for teams already working in VS Code or Visual Studio who need one debugger across Node, browser and WASM targets, and for editors such as Neovim that can host a standalone DAP server. It is a poor fit if you need a debugger that can be installed from npm into an arbitrary toolchain, or if your Node.js target is older than 22.6.0 and you depend on the network view.
- Can I use it commercially?
- Yes. MIT is a permissive licence: you can use, modify and sell software built on it, as long as you keep its copyright and licence notices.
- Is it still maintained?
- Yes. The repository last received commits 2 days ago.
- What is it written in?
- Mainly TypeScript, according to GitHub's language statistics.
Answers come from the project's GitHub data, last synced on November 6, 2026, and from our analysis. They are not legal advice.
Star history
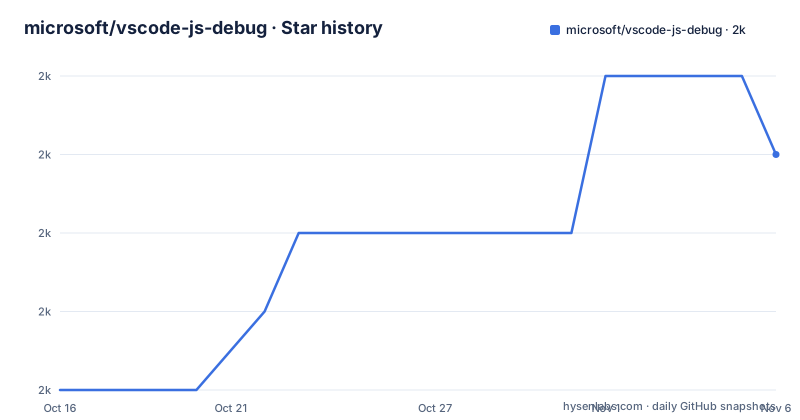
- microsoft/vscode-js-debug1,987 ★ · +3
| Repository | 2026-10-16 | 2026-11-06 |
|---|---|---|
| microsoft/vscode-js-debug | 2k | 2k |
3 Stars in the last 21 days, measured from the daily GitHub snapshot. Compare with other projects
Editorial analysis
A DAP server that already ships inside VS Code and Visual Studio
js-debug is a Debug Adapter Protocol implementation. That detail shapes everything about how you use it: the debugger talks to an editor over a standard protocol rather than through editor specific APIs. The README states that it is the default JavaScript debugger in Visual Studio Code and in Visual Studio, and that the standalone debug server can be used in other tools such as Neovim through the nvim-dap project. The scope the project claims is broad: Node.js, Chrome, Edge, WebView2, VS Code extensions, Blazor and React Native. For a full stack developer who is chasing a request from a browser bundle into a Node service, the practical point is that one adapter covers both ends instead of two unrelated debuggers with different breakpoint semantics. The audience is therefore mostly developers already inside VS Code or Visual Studio, where nothing needs to be installed, plus editors willing to host a DAP server and accept that the server carries the debugging logic.
Node children, web workers and WebAssembly binaries all attach automatically
The mechanism that distinguishes this debugger from a plain script attach is automatic discovery of the places where code actually runs. In Node.js, child processes and worker threads are debugged automatically, so you do not need separate launch configurations for a forked worker or a process spawned by a test runner. In the browser, service workers, web workers and iframes are picked up as well, and while you are paused in a worker you can step through postMessage calls rather than losing the thread. WebAssembly is handled by reading DWARF symbols out of the binary directly, which brings the usual breakpoints, stack inspection and stepping to WASM, with evaluation support described as limited and routed through lldb-eval. The trade-off is that this breadth comes from the adapter doing the discovery work for you, which means you trade away precise control over what gets attached and when.
Getting a build: the shipped extension, the nightly channel, or the standalone server
There is no install step to invent here. If you use Visual Studio or Visual Studio Code, the README says js-debug is already installed with it, and for any other editor it tells you to consult that editor's documentation. Builds of the VS Code extension and of the standalone DAP server are published on the releases page. The README also documents a nightly channel, which is the interesting part for anyone who needs a fix faster than the editor ships it: the shipped extension carries the js-debug version that existed when that editor release was cut, while the nightly build is produced at 5PM PST on each day that there are changes. To switch, open the extensions view, disable the built-in JavaScript Debugger extension, then install the nightly one. The two extension ids are the only values you need:
@id:ms-vscode.js-debug
@id:ms-vscode.js-debug-nightly
Search for the built-in id, disable it, then install the nightly id. The extensions view is opened with ctrl+shift+x. After the swap your editor runs a nightly adapter, which is what you want when a fix has landed upstream but your editor release is older.
Auto Attach is how a plain npm start becomes a debug session
The most useful entry point for Node.js work is Auto Attach, because it removes the launch configuration from the loop. Any Node.js process you run in the terminal can be debugged once Auto Attach is on, which means a command such as npm start is enough to get a debuggable process. The README gives the command to flip the setting, and the same behaviour can be toggled from a button in the status bar labelled Auto Attach: On/Off. You can also open a dedicated shell rather than attaching to whatever runs next:
Debug: Toggle Auto Attach
Debug: Create JavaScript Debug Terminal
Both are commands from the command palette. Once a session is running the debugger behaves as usual, with breakpoints, the call stack view and the variable panes.
Sourcemaps, renamed identifiers and the minified code problem
Debugging built output is where this debugger shows its engineering, and it works through sourcemaps rather than by ignoring them. Files can be pretty printed on the fly, either from the braces icon in the editor actions or through a command in the palette, which matters when the only code you have is a minified bundle. The feature that goes further is rename support: when a tool emits renames in its sourcemap, the debugger maps renamed variables in all displayed views and rewrites evaluation requests to use the renamed identifiers, which gives something close to source level debugging of minified code. A related detail is return value interception, where a function's return statement lets you use, inspect and modify the $returnValue. You can change properties on it, but you cannot assign it, because it behaves like a const variable.
Profiling is built in, but the network view is still behind a flag
Performance work does not require leaving the editor. The debugger captures and renders profiles natively in VS Code, reachable from a button in the Call Stack view or from a command in the palette:
Debug: Take Performance ProfileThe profile data collected through VS Code is sourcemap-aware, which keeps the attribution sensible for bundled code. CPU profiles, heap profiles and heap snapshots are all supported. The network view is the odd one out. It is labelled experimental, it must be turned on with a setting, and it covers browser targets plus Node.js targets running 22.6.0 or newer. On older Node.js releases the feature is simply unavailable, and even where it exists the README frames it as experimental rather than settled. Treat it as something to try when you need request level visibility, not as a dependable part of the debugging workflow.
Breakpoint control that goes past stop-on-everything
Several of the smaller features are worth knowing because they remove the need to litter source with temporary breakpoints. Instrumentation breakpoints are configured from the Event Listener Breakpoints view and apply when debugging web apps. Exception breakpoints can be filtered against the error object rather than pausing on every caught exception, which is set from the pencil icon in the Breakpoints view. Excluded callers let you keep a breakpoint but skip it when a particular frame is in the stack trace, by right clicking a call frame and choosing the exclude caller action. Conditional exception breakpoints and excluded callers both express a rule about when to stop, which is the difference between a debugger that halts on everything and one you can leave running against noisy code.
Upgrade cost: version skew between your editor and the adapter
The maintenance picture is healthy. The repository is not archived, the last push was on 2026-10-13, and the extension version is 1.140.0 with a release on 2026-09-23, following earlier releases on 2026-04-17 and 2026-03-13. The licence is MIT. The upgrade cost is less about the code and more about the distribution model: the copy inside VS Code is frozen at the editor's release, so the only ways to get newer fixes are the nightly extension or a manual build from the releases page. In a team that pins editor versions, one member may be debugging with a newer adapter than the rest. The repository also keeps OPTIONS.md as the list of options available in launch configurations, which is the reference to check before assuming a setting exists in the version your team actually has.
Editorial conclusion
js-debug is the right choice for teams already working in VS Code or Visual Studio who need one debugger across Node, browser and WASM targets, and for editors such as Neovim that can host a standalone DAP server. It is a poor fit if you need a debugger that can be installed from npm into an arbitrary toolchain, or if your Node.js target is older than 22.6.0 and you depend on the network view. Before adopting it outside VS Code, verify the standalone server build you download from the releases page against your editor's DAP expectations, and confirm that the sourcemap handling of your bundler matches the rename rewriting the debugger performs.
Frequently asked questions
How do I install the JavaScript debugger in VS Code?
You do not need to. The README says js-debug is already installed as the default JavaScript debugger in Visual Studio Code and in Visual Studio. For other editors, the project points to the releases page for builds of the VS Code extension and the standalone DAP server.
How do I debug a Node.js process I start in the terminal?
Turn on Auto Attach with the Debug: Toggle Auto Attach command, or use the Auto Attach: On/Off button in the status bar. Any Node.js process you then run from the terminal, for example npm start, is debugged automatically, and a separate command creates a dedicated JavaScript debug terminal.
Can js-debug debug WebAssembly and worker threads?
Yes. It reads DWARF symbols from WebAssembly binaries, with evaluation support described as limited and provided through lldb-eval. In Node.js child processes and worker threads are debugged automatically, and in browsers service workers, web workers and iframes are picked up as well.
Official sources
Add this badge to your README
If you maintain this project, the badge below links readers to this analysis and shows its maintenance status from the daily GitHub snapshot. Paste the markdown into your README; add ?metric=license or ?metric=stars to the image URL for a different field.

[](https://hysenlabs.com/projects/microsoft-vscode-js-debug)Star history chart for your README
[](https://hysenlabs.com/projects/microsoft-vscode-js-debug)Was this useful?