NanoVNA-Saver turns a small vector analyser into a filter and antenna bench
A tool for reading, displaying and saving data from the NanoVNA
At a glance
- What is it?
- NanoVNA-Saver is a Python desktop application that talks to a NanoVNA over a serial port, splits a sweep into segments to push past the 101 point limit, calibrates in application, and exports Touchstone files for S11 and S21 work. It is the piece of software that makes cheap hardware usable for real measurements.
- Who is it for?
- Adopt NanoVNA-Saver if you own a NanoVNA and want more than the device's own screen gives you, since the segmented sweeps, in-application calibration, filter analysis and Touchstone export are what turn a toy into an instrument. Do not adopt it if you only need a one-off reading, because a bare device can do that on its own.
- Can I use it commercially?
- Not without permission. GitHub finds no licence file in the repository, and without a licence all rights are reserved by default: you may read the code but not reuse it. Check the README, or ask the authors, before using it.
- Is it still maintained?
- Activity is slowing. The repository last received commits 6 months ago.
- What is it written in?
- Mainly Python, according to GitHub's language statistics.
Answers come from the project's GitHub data, last synced on November 7, 2026, and from our analysis. They are not legal advice.
Star history
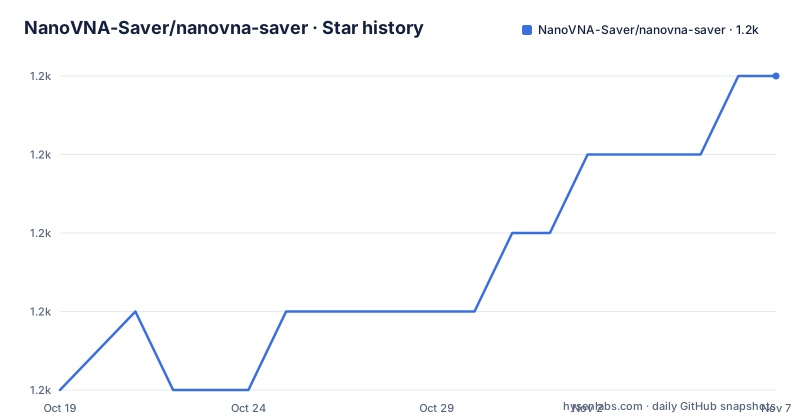
- NanoVNA-Saver/nanovna-saver1,243 ★ · +4
| Repository | 2026-10-19 | 2026-11-07 |
|---|---|---|
| NanoVNA-Saver/nanovna-saver | 1.2k | 1.2k |
4 Stars in the last 19 days, measured from the daily GitHub snapshot. Compare with other projects
Editorial analysis
The 101 point limit is the thing to work around
The core idea of the application is a workaround for a hardware constraint. A NanoVNA sweep gives 101 data points, and the application lets you split a frequency range into multiple segments so you can have far more than that, with the documentation mentioning trials up to more than 10k points. Each segment takes about 1.5 seconds to complete, so the trade is time for resolution, and it is a trade the user makes explicitly by entering a segment count. That is also why live updates during multi-segment sweeps are called out as a feature: without it, a ten segment sweep would appear frozen for fifteen seconds. Frequencies are entered in Hz with k and M suffixes, and scientific notation such as 6.5e6 for 6.5MHz also works, which is the small ergonomic detail that matters when you are typing a range by hand.
Device support is broader than the name suggests
The compatible device list is wider than the product name implies: the NanoVNA itself, the NanoVNA-H, the NanoVNA-H4, the NanoVNA-F, AVNA via Teensy, and LiteVNA. The application also reads data from a TinySA, so you can bring its data into the same charting environment. The connection itself is over a serial port. If the device is already plugged in when the application starts it is detected automatically, otherwise you click Rescan and then Connect to device, and the serial port is entered in a box on the window. The tool is written in Python 3.10 or newer using PySide6, numpy and scipy, with pyserial handling the port, and the project also ships a GUI entry point alongside the console one.
Charts are what a vector analyser is for
The display options cover the chart types that make a VNA useful: Smith, LogMag, Phase and VSWR, for both S11 and S21. Markers can be placed by mouse or typed in, and the readouts at those positions give impedance, VSWR, Q, and equivalent capacitance or inductance, which is the point of the whole exercise since a raw S11 number means nothing to most people. The documentation describes selecting the active marker with radio buttons, or holding shift while clicking to drag the nearest marker, and the readout boxes show the actual frequency where values are measured. Reference bands can be displayed for things like amateur radio bands, and both an active trace and a reference trace can be shown at once, so you can compare a measurement before and after a change on the same axes.
Calibration is the part that decides if the numbers mean anything
The documentation opens the calibration section with a warning that you should ensure the device itself is in a reasonable calibration state before using the application, and explains why: a completely uncalibrated NanoVNA may produce readings that fall outside the range the application accepts. A calibration of both ports across the entire frequency span, saved to save slot 0, is described as sufficient. The application can then calibrate in two ways, either assuming ideal standards or applying the relevant standard correction, and you do it manually by sweeping each standard in turn and pressing the matching button, or with the Calibration Assistant, where you can attach a note describing the conditions under which the calibration was performed. Calibration results and their notes can be saved and loaded, and after pressing Apply the calibration is immediately applied to the latest sweep data. Users with characterised standard sets can enter the data for those and save the sets. One limitation is stated bluntly: load capacitance is currently unsupported.
Beyond the sweep: TDR, filters and permeability
Three features take the tool past what the device itself does. The TDR function measures cable length, with an impedance display, and the documentation is specific about how to get a good result: calibrate the device and attach the cable at the calibration plane, the same position where the calibration load would go, then open the Time Domain Reflectometry window and select the cable type or enter a propagation factor manually. The filter analysis functions cover low-pass, high-pass, band-pass and band-stop filters. And the permeability measurement uses a one-port measurement, where you put one or more windings on a core of known dimensions and use the S11 mu plot, with the core cross-section area, effective length and number of windings set from the plot's context menu. The Touchstone export and import covers 1-port and 2-port files, and images of plotted values can be exported.
Packaging for Linux is a Makefile with stdeb
The repository carries a Makefile whose whole job is producing distribution packages, and it uses stdeb rather than a hand written packaging recipe:
make deb
make debinstall
The `deb` target builds a Debian package with the stdeb command, places the result in the current directory as a symlink to the newest file in `deb_dist`, and lists it. The `debinstall` target builds the package and then installs the local file with apt, and there is a `debuninstall` target that purges it. An rpm target exists too and is labelled experimental in the target's own echo output. The rest of the project is modern Python packaging: a pyproject.toml with the dependencies and the entry points, a uv.lock file, a tox.ini, and a dev dependency group covering ruff, mypy, pylint, pytest with coverage, tox and pyinstaller. Binary releases for Windows and Linux are published on the releases page, and the project is under GPL-3.0-or-later with the copyright held by Rune B. Broberg for 2019 and 2020 and by the NanoVNA-Saver authors from 2020 onwards.
Where the project stands
The release history shows a project that moved in features rather than in cadence. v0.7.3 is titled Sweeping bands, v0.7.2 Sliding triangles and v0.7.1 Shiny Colored Windows, all three within a couple of weeks in February 2025, and the last push to the main branch was on 2026-04-18. The package metadata classifies the project as Development Status 4 - Beta, with the intended audience as science and research and the telecommunications industry, and the topic as communications and ham radio. Development happens mainly on Linux with Debian 11, and the contributing guide is in the docs directory. The most recent changes listed are the move to PySide6 and the switch to uv and pyproject.toml, which is a project tidying its packaging rather than changing what it measures.
Editorial conclusion
Adopt NanoVNA-Saver if you own a NanoVNA and want more than the device's own screen gives you, since the segmented sweeps, in-application calibration, filter analysis and Touchstone export are what turn a toy into an instrument. Do not adopt it if you only need a one-off reading, because a bare device can do that on its own. Verify first that your device is calibrated before you trust the numbers, since the documentation states that an uncalibrated NanoVNA may produce readings outside the range the application accepts, and check that the segment count you choose does not take longer than you are willing to wait.
Frequently asked questions
How do I connect NanoVNA-Saver to my device?
Connect the NanoVNA to a serial port and enter that port in the serial port box. If the device is already connected before the application starts it is detected automatically, otherwise you click Rescan and then Connect to device.
Why should I use multiple segments when sweeping?
Each segment of a sweep gives 101 data points and takes about 1.5 seconds, so splitting the frequency range into segments raises the total point count well beyond 101, with the documentation mentioning trials up to more than 10k points.
Do I need to calibrate the NanoVNA before using NanoVNA-Saver?
The documentation says to ensure the device is in a reasonable calibration state, because a completely uncalibrated NanoVNA may produce readings outside the range the application accepts. A calibration of both ports across the whole frequency span saved to slot 0 is described as sufficient.
Which devices does NanoVNA-Saver support?
The NanoVNA, NanoVNA-H, NanoVNA-H4, NanoVNA-F, AVNA via Teensy and LiteVNA, and it can also read data from a TinySA. The application is written in Python 3.10 or newer with PySide6, numpy, scipy and pyserial.
Can NanoVNA-Saver measure cable length and filter response?
Yes. It has a TDR function that measures cable length with an impedance display, using the calibration plane as the reference point, and filter analysis for low-pass, high-pass, band-pass and band-stop filters. One-port measurements can also give core permeability using the S11 mu plot.
Official sources
Add this badge to your README
If you maintain this project, the badge below links readers to this analysis and shows its maintenance status from the daily GitHub snapshot. Paste the markdown into your README; add ?metric=license or ?metric=stars to the image URL for a different field.

[](https://hysenlabs.com/projects/nanovna-saver-nanovna-saver)Star history chart for your README
[](https://hysenlabs.com/projects/nanovna-saver-nanovna-saver)Was this useful?