pydot: driving Graphviz from Python without writing DOT by hand
Python interface to Graphviz's Dot language
At a glance
- What is it?
- pydot is a pure Python interface to Graphviz and its DOT language, with one dependency, pyparsing, used only for reading existing DOT files rather than for building them. It suits a Python program that needs to emit a diagram as part of its output, and the two DOT strings it can return are the detail that trips people up.
- Who is it for?
- pydot fits a Python program that generates a graph from its own data and needs a PNG, SVG or PDF at the end, because the API is small, the dependency footprint is one package and the DOT output is stable enough to hand to Graphviz yourself. Skip it if you need to parse arbitrary DOT reliably, because pyparsing is the only dependency and it is used solely for loading, so complex input is where you will feel the difference.
- Can I use it commercially?
- Not without permission. GitHub finds no licence file in the repository, and without a licence all rights are reserved by default: you may read the code but not reuse it. Check the README, or ask the authors, before using it.
- Is it still maintained?
- Yes. The repository received new commits within the last day.
- What is it written in?
- Mainly Python, according to GitHub's language statistics.
Answers come from the project's GitHub data, last synced on November 7, 2026, and from our analysis. They are not legal advice.
Star history
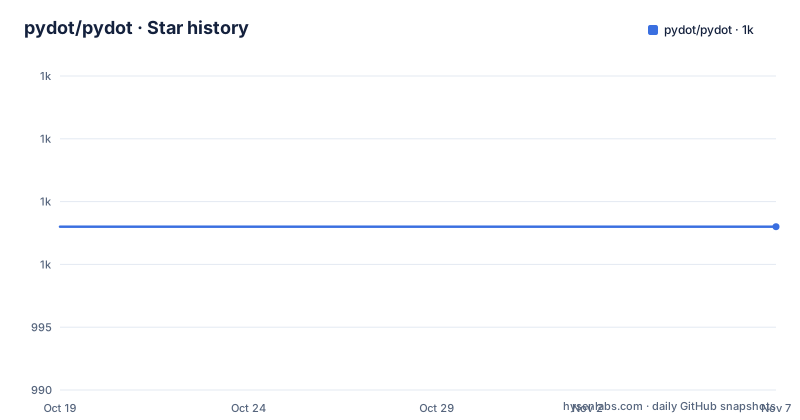
- pydot/pydot1,003 ★ · +0
| Repository | 2026-10-19 | 2026-11-07 |
|---|---|---|
| pydot/pydot | 1k | 1k |
0 Stars in the last 19 days, measured from the daily GitHub snapshot. Compare with other projects
Editorial analysis
One dependency, and it is only used for reading
pydot is a Python interface to Graphviz and its DOT language, and you can use it to create, read, edit and visualize graphs.
The dependency story is unusual and worth knowing precisely. It is made in pure Python, with only one dependency, pyparsing, other than Graphviz itself. And the dependency note is more specific still: pyparsing is used only for loading DOT files, installed automatically during pydot installation.
Installing it is one command for the released version:
pip install pydotAnd the development install from a clone is an editable install into a virtual environment:
git clone https://github.com/pydot/pydot
cd pydot
python3 -m venv _venv
. ./_venv/bin/activate
pip install -e .
That single sentence explains the shape of the library. Building a graph is string generation, because DOT is a text format, and that needs nothing but the standard library. Reading a DOT file is parsing, and that is a real problem, so pyparsing does it.
The practical consequence is that pydot is cheap to install and cheap to keep, with no compiled extension and no C library beyond Graphviz itself. And the practical cost is that the parsing path is where the complexity lives, so if you are reading DOT produced by an unfamiliar tool with unusual syntax, that is where you will look for problems.
Graphviz itself is a separate installation. It is used to render graphs in a variety of formats, including PNG, SVG, PDF and more, and should be installed separately using your system's package manager, something similar such as MacPorts, or from its source.
That separation is the key architectural point. pydot does not contain a layout engine, it drives one. The layout, the fonts, the rendering are Graphviz's, and pydot's job is to talk to it and to get the text right.
The compatibility with networkx is also stated as a feature, that it is compatible with networkx, which can convert its graphs to pydot. And the licence is MIT, with the SPDX header naming the pydot contributors for 2024.
Four ways in, and the one that scales
The quickstart opens with the input stage, and the four ways of getting data in are the clearest picture of the library's scope.
The first is an existing DOT file, read with `pydot.graph_from_dot_file`, which returns a list of graphs and the example takes the first.
The second is a DOT string, read with `pydot.graph_from_dot_data`.
The third is building a graph from scratch with pydot objects, and this is where the documentation says the cool stuff starts. A `pydot.Dot` object is created with a name, a graph type and attributes, nodes are added with `add_node`, and edges with `add_edge`, each node and edge being a `pydot.Node` or `pydot.Edge` with a name and keyword attributes. Every call accepts an intermediate variable or an inline object, so the terse form is available when it helps.
The fourth is a networkx graph, converted with `networkx.drawing.nx_pydot.to_pydot`.
What matters here is that the third path is the one that scales, and the documentation is explicit about the pattern. Start with a basic pydot.Dot graph object, then loop through your data as you add nodes and edges, using values from your data as labels to determine shapes, edges and so on. This allows you to easily create visualizations of thousands of related objects.
That is the real use of pydot. A hand written DOT file is fine for a diagram with six boxes, and pydot earns its place when the diagram is a function of a data set and the same code has to run again next month with different rows. It is a templating layer over a text format that a tool already renders well.
The object model is worth noting as well. `pydot.Dot` is a graph, and there are separate `pydot.Graph` and `pydot.Digraph` types for the undirected and directed variants of the DOT language, with `graph_type` being how you choose between them. A Dot object with `graph_type="graph"` is undirected, which matters because DOT renders the two differently and the node and edge direction carries meaning in the output.
Editing is attribute mutation, and it is a list under the hood
The edit stage is where the object model shows through, and one detail is worth pausing on.
Adding more nodes and edges is `graph.add_edge(pydot.Edge("b", "d", style="dotted"))`. Editing attributes of graphs, nodes and edges is `graph.set_bgcolor("lightyellow")` and `graph.get_node("b")[0].set_shape("box")`.
Look at the indexing in that second call. `get_node("b")` returns a list, and the code takes `[0]`. That is not an accident of the example, it is the shape of the API, and it comes from DOT's own semantics. In DOT an identifier is not necessarily unique, a graph can contain two nodes with the same name and different attributes, and an edge is identified by its endpoints rather than by a name. So a lookup by name is genuinely ambiguous, and pydot returns the candidates rather than picking one for you.
That has two consequences. The first is that `get_node("b")[0]` is the correct way to reach a node when you know the graph is well formed, and the wrong way when it is not, since you may edit the wrong one. The second is that `set_bgcolor` is a method on the graph rather than an attribute assignment, and the naming pattern repeats across the object types with `set_` and `get_` prefixes.
For most users, none of this matters. You build a graph once, you write it out, and the round trip through the text format is invisible. It matters when you are editing a graph you did not build, or when you are merging two graphs, and it is the reason the `to_string` output is worth reading before you write it back out.
Two DOT strings, and they are not the same
The output stage has four options, and one of them contains a distinction that will save you a confusing debugging session.
There are two different DOT strings you can retrieve. The first is the raw pydot DOT. This is generated the fastest and will usually still look quite similar to the DOT you put in. It is generated by pydot itself, without calling Graphviz. You get it as a string with `graph.to_string()` or you save it as a DOT file with `graph.write_raw("output_raw.dot")`.
The second is the Graphviz DOT. You can use it to check how Graphviz lays out the graph before it produces an image. It is generated by Graphviz. You get it as a bytes literal with `graph.create_dot()` or you save it with `graph.write_dot("output_graphviz.dot")`.
The reason there are two is that Graphviz normalises. Your input DOT may use shorthand, may omit default attributes, may write edge chains as `a -- b -- c` where the graph really has two edges, and Graphviz's own output expands that into the fully explicit form with every attribute written out and every node materialised. The raw string is what you wrote; the Graphviz string is what Graphviz understood.
That difference is exactly what makes the Graphviz DOT useful. It is the tool for answering the question of what Graphviz actually parsed, and if a graph is not rendering the way you expect, comparing the two strings usually shows the answer, because the difference between them is the part Graphviz reinterpreted.
The image output is the same idea applied to the rendered result. The `write_*` methods save the image to a file, for example `graph.write_png("output.png")`, and the `create_*` methods give you a Python `bytes` object instead, for example `output_graphviz_svg = graph.create_svg()`.
For a notebook, the documentation shows the SVG route with `IPython.display.SVG` and the bitmap route with `IPython.display.Image` and `graph.create_png()`. And the round trip back to networkx is `networkx.drawing.nx_pydot.from_pydot(graph)`.
Where pydot stops, and the log warning to read
There are three limits worth stating, and one of them is a security note buried in the troubleshooting section.
The first is that Graphviz is a separate dependency that has to be installed on the machine. The rendering step shells out to the real binaries, so pydot alone does not produce images. That is a small thing to know before you write a deployment script that assumes the import works means the picture works.
The second is the parsing path. pyparsing is used for loading DOT files, and it is the only dependency, which means the loader is a general purpose parser rather than something tuned for the DOT grammar. Fine for well formed input, and a place to look when a file from another tool does not load as expected.
The third is that pydot is a DOT library, not a Graphviz library. It covers the language, but it does not cover the layout engines, the shapes catalogue or the filters, and the escaping rules of the DOT format are not something pydot invents for you. Anything exotic in DOT syntax is expressed as a string attribute.
The logging note is the one to actually read. pydot uses Python's standard `logging` module, and to see the logs, assuming logging has not been configured already, you run `logging.basicConfig(level=logging.DEBUG)` before importing pydot, and the output shows the module initialising. The warning that follows is explicit: when DEBUG level logging is enabled, pydot may log the data that it processes, such as graph contents or DOT strings.
That is a real warning in a real scenario. If your DOT file contains a node label with a hostname, an internal identifier or a piece of a URL that is sensitive, and you have turned on debug logging to diagnose a parse problem, that data goes to your log aggregator. The troubleshooting section stops mid-sentence in the source, but the point is legible from what is there, and it is the kind of thing to know before you paste a production graph into a shared logging system.
For help beyond the README, the documentation points at the docstrings, with `help(pydot)`, `help(pydot.Graph)` and `help(pydot.Dot.write)` as the examples, and says more documentation contributions are welcome.
Editorial conclusion
pydot fits a Python program that generates a graph from its own data and needs a PNG, SVG or PDF at the end, because the API is small, the dependency footprint is one package and the DOT output is stable enough to hand to Graphviz yourself. Skip it if you need to parse arbitrary DOT reliably, because pyparsing is the only dependency and it is used solely for loading, so complex input is where you will feel the difference. Before you adopt it, install Graphviz itself, since the rendering step shells out to the real binaries, and decide which of the two DOT strings you want, because the raw one and the Graphviz one differ. The last push was on 2026-10-13 and the project is MIT licensed with a 5-Production/Stable classifier.
Frequently asked questions
What is pydot and what does it need to work?
It is a Python interface to Graphviz and its DOT language, made in pure Python with one dependency, pyparsing, used only for loading DOT files. Graphviz itself must be installed separately, since it is what actually renders the graph to PNG, SVG, PDF and other formats.
What is the difference between to_string and create_dot in pydot?
The raw pydot DOT from `to_string` is generated by pydot itself without calling Graphviz and looks like the DOT you put in. The Graphviz DOT from `create_dot` is generated by Graphviz and shows how Graphviz actually laid out and normalised the graph.
How do I convert a networkx graph to pydot?
Use `networkx.drawing.nx_pydot.to_pydot(my_networkx_graph)`, and the reverse direction is `networkx.drawing.nx_pydot.from_pydot(graph)`.
Which Python versions does pydot support?
The latest version supports Python 3.9 and later. It may work with Python 3.6 to 3.8 but full support is not guaranteed, and the package metadata declares requires-python of 3.8 with classifiers up to Python 3.15.
Is there a security concern with enabling pydot debug logging?
Yes. The documentation warns that when DEBUG level logging is enabled, pydot may log the data it processes, such as graph contents or DOT strings, so sensitive labels can end up in your logs.
Official sources
Add this badge to your README
If you maintain this project, the badge below links readers to this analysis and shows its maintenance status from the daily GitHub snapshot. Paste the markdown into your README; add ?metric=license or ?metric=stars to the image URL for a different field.

[](https://hysenlabs.com/projects/pydot-pydot)Star history chart for your README
[](https://hysenlabs.com/projects/pydot-pydot)Was this useful?