cfviz turns a Codeforces handle into a chart of how you actually solve
Visualizes user data from codeforces.com using the official API
At a glance
- What is it?
- cfviz is a small static site that reads a Codeforces account through the official API and renders the history as charts, with a verdict breakdown, a language breakdown, tag and level charts, counts of solved and attempted problems, a list of problems you have not solved, a side by side comparison of two handles, and a virtual rating change page. It is a jQuery and Google Charts site with a service worker, and it publishes its own known issues rather than hiding them.
- Who is it for?
- cfviz is the right tool if you coach competitive programmers, teach a group, or want to see your own practice pattern in one place, because the single user view is built around the questions a person actually asks, which languages you use, which problem tags you never touch, and which problems you have attempted but not finished.
- Can I use it commercially?
- Not without permission. GitHub finds no licence file in the repository, and without a licence all rights are reserved by default: you may read the code but not reuse it. Check the README, or ask the authors, before using it.
- Is it still maintained?
- Yes. The repository last received commits 131 days ago.
- What is it written in?
- Mainly JavaScript, according to GitHub's language statistics.
Answers come from the project's GitHub data, last synced on November 7, 2026, and from our analysis. They are not legal advice.
Star history
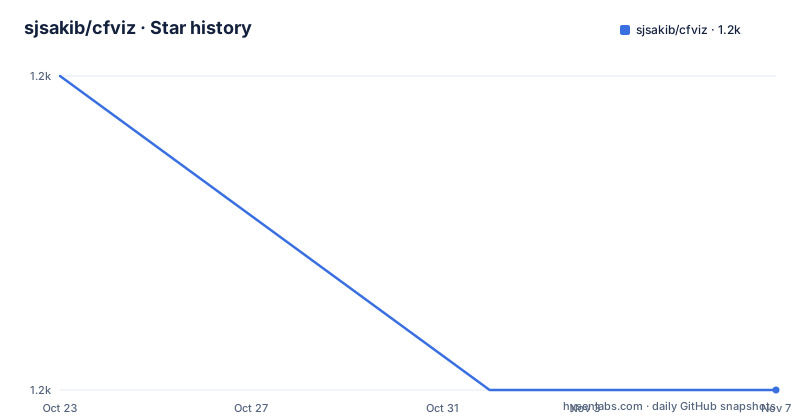
- sjsakib/cfviz1,186 ★ · -1
| Repository | 2026-10-23 | 2026-11-07 |
|---|---|---|
| sjsakib/cfviz | 1.2k | 1.2k |
-1 Stars in the last 15 days, measured from the daily GitHub snapshot. Compare with other projects
Editorial analysis
The data comes from the public API, and only from it
The project is a code repository for a simple analytics visualization site for Codeforces online judge users, using the Codeforces API, and the site is hosted at cfviz.netlify.app. Everything the site shows is therefore derived from what the official API exposes about a handle, which is a constraint that shapes the whole design. There is no database, no account and no tracking, and the analysis is recomputed when the page loads. That makes the project a good example of a client-only analytics application, and it also means the features are bounded by the API, since anything the API does not return cannot be charted. The two views are single user analytics and a comparison between two users, and the comparison view is the more interesting of the two, because it puts two solved-problem sets next to each other.
What the single user view shows
The single user analytics view is a list of charts and counters, and reading it tells you what the author thought was worth showing. There is a verdicts chart, a languages chart, a tags chart and a levels chart, so the four views are how you solve, in what you solve it, and how hard the problems are. Then there are the counts. The total tried problems count and the total solved problems count, the average and max attempts, the count of problems solved with one submission, and the max AC for a single problem, which the README explains indicates in how many ways someone solved a problem, which is the metric that separates a first-try solver from a grinder. The last item is a list of unsolved problems, which is the only view that is actionable, since everything else describes the past and that one is a work list. The levels chart deserves a note, because the level is what tells you whether your practice is in the range where you can win.
The comparison view, which is the reason to use the site
The comparison between two users mirrors the single user view, which makes it easy to read the two side by side rather than having to remember what each chart meant. It compares the current, max and min rating, the number of contests, the best and worst position in a contest, and the max positive and negative rating change. It also draws the compared rating timeline, which is the chart that answers the question two people actually argue about, who has been improving. Then it repeats the problem statistics in comparison form, the total tried and total solved problem counts compared, the average and max attempts compared, the count of problems solved with one submission compared, the max AC for a single problem compared, and the tags compared and the levels compared. The tags comparison in particular is the one that shows where two competitors differ in substance rather than in score.
Three known issues, published in the README
The Issues section is the most valuable part of the README for anyone deciding whether to trust the numbers, because it names the three ways the site can mislead. The first is that when somebody searches for a handle that does not exist, the request is blocked cross-origin and the status code becomes 0 in jQuery, so the site cannot determine whether the user really does not exist or some other network problem occurred. The second is that Firefox hangs for a while when drawing the tags comparison chart, probably because the chart is big, and the author has a plan to divide that chart in two parts. The third is a counting error, that when counting the number of solved problems, some problems that appear both in div 1 and div 2 get counted twice. That last one matters for the headline number, because a competitive programmer's solved count on Codeforces itself has the same subtlety, and the site is the place where you would notice it.
A static site with a service worker and no build step
The repository layout shows how small this is. There is no src/ directory, no bundler configuration and no package manifest, just about.html, compare.html, index.html, virtual-rating-change.html, and the images/, js/, styles/ directories, plus a manifest.json and a sw.js. The manifest and the service worker make it an installable progressive web app, which is the point for a site you add to your phone once and open from a bookmark when you want to check a rating. The virtual-rating-change.html page is a separate view worth noticing, since it lets you ask what your rating would have been under a different assumption, which is a question every competitor has asked at some point. The libraries in use are jQuery and Google Charts, visible in the repository topics and in the issue text, and the choice of Google Charts for the charts explains the Firefox behaviour on the large tags chart, since that rendering path is where the hang is.
Where cfviz stops, and what it is for
The limits are clear once you know the design. It is a read-only view over public API data, so it has no notion of private contest performance, no per-problem timeline of when you attempted something, and no notion of the practice you did outside the judge. It is also a client-side application, so a page that draws a dozen charts and a comparison is doing a dozen API requests in the browser, and the readme's first issue is a symptom of that, since a failed request cannot be told apart from a missing user. For a team that wants the data rather than the pictures, the API is the product and this is a good client for it. For a coach, the unsolved list and the tag comparison are the payload, because they turn a rating into a curriculum, and the site is at its best when you run two handles side by side and see which tags one of them has never touched. The contribution model is the plain one, with a .prettierrc for formatting and a .gitignore, and the project is small enough that a fix for the double counting, or the split of the tags chart, would be a quick contribution.
Editorial conclusion
cfviz is the right tool if you coach competitive programmers, teach a group, or want to see your own practice pattern in one place, because the single user view is built around the questions a person actually asks, which languages you use, which problem tags you never touch, and which problems you have attempted but not finished. It is the wrong tool for a team that needs an export or a queryable dataset, since this is a browser application that draws charts rather than a data pipeline, and it is the wrong tool if the Codeforces API is not enough for you, because the site only goes as far as the public API goes. Before you rely on a number it shows, read the issues section, because a solved count can be inflated by problems that appear in both divisions and a handle that does not exist is indistinguishable from a network failure.
Frequently asked questions
What does cfviz show for a Codeforces user?
A verdicts chart, a languages chart, a tags chart and a levels chart, the total tried and total solved problem counts, the average and max attempts, the count of problems solved with one submission, the max AC for a single problem, and a list of unsolved problems. A second view compares two handles on rating, contests, best and worst position, rating change, the same problem statistics, and their tags and levels.
Where does cfviz get its data?
From the Codeforces API. The site is a client-side static application hosted at cfviz.netlify.app, so everything it charts is recomputed from the official API responses for the handle you enter, and there is no database or account behind it.
What are the known problems with cfviz?
Three, all listed in the README. A handle that does not exist produces a cross-origin request failure with a status code of 0 in jQuery, so it cannot be told apart from a network problem. Firefox hangs for a while drawing the tags comparison chart, probably because the chart is large. And some problems that appear in both div 1 and div 2 get counted twice when counting solved problems.
What is the virtual rating change page in cfviz?
It is a separate page, virtual-rating-change.html, alongside the index, the comparison and the about pages. The site is a small set of static HTML pages with a js/ and styles/ directory, plus a manifest.json and a service worker that make it installable as a progressive web app.
Official sources
Add this badge to your README
If you maintain this project, the badge below links readers to this analysis and shows its maintenance status from the daily GitHub snapshot. Paste the markdown into your README; add ?metric=license or ?metric=stars to the image URL for a different field.

[](https://hysenlabs.com/projects/sjsakib-cfviz)Star history chart for your README
[](https://hysenlabs.com/projects/sjsakib-cfviz)Was this useful?