Memtrace's public repository is documentation, benchmarks and plugins
Structural memory for AI coding agents. Bi-temporal graph, MCP-native, zero LLM calls. Cursor · Claude Code · Codex · DeepSeek Harness · Hermes · VS Code · Windsurf.
At a glance
- What is it?
- The syncable-dev/memtrace-public repository carries no source directory: it holds the docs, the benchmark reports, plugin manifests, release notes and a changelog file for a code graph that is installed as an npm package and is still in private beta. The README is precise about the numbers and vague about the license, which GitHub reports as undetected.
- Who is it for?
- Read this repository as the documentation and support surface for a closed binary, which is exactly what it is. It is worth your time for two things: the benchmark suite, which names its rivals and states how the ground truth was produced, and the bi-temporal model, which is a real answer to a question an AST graph cannot take.
- Can I use it commercially?
- Check first. The repository uses a licence we do not classify automatically, so read its LICENSE file before any commercial use.
- Is it still maintained?
- Yes. The repository last received commits 1 day ago.
- What is it written in?
- Mainly Python, according to GitHub's language statistics.
Answers come from the project's GitHub data, last synced on November 15, 2026, and from our analysis. They are not legal advice.
Star history
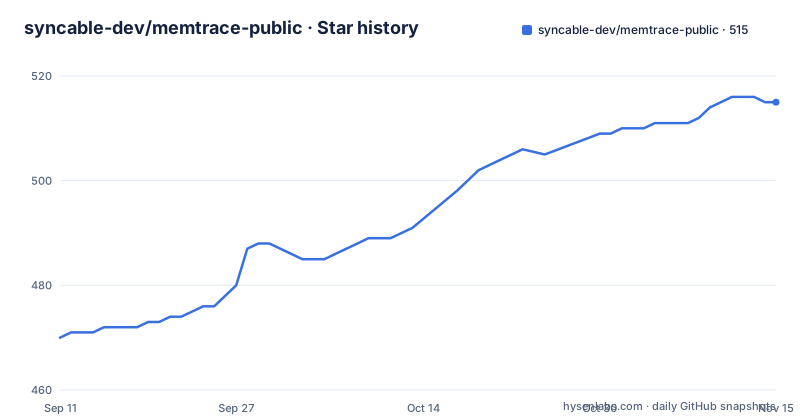
- syncable-dev/memtrace-public515 ★ · +45
| Repository | 2026-09-11 | 2026-11-15 |
|---|---|---|
| syncable-dev/memtrace-public | 470 | 515 |
45 Stars in the last 65 days, measured from the daily GitHub snapshot. Compare with other projects
Editorial analysis
The root has no source directory, and the install comes from npm
Start with the shape of the repository, because it decides what kind of project this is. The top level holds a README, a license file, a contributing guide, two privacy documents, a changelog file in JSON, four files of benchmark results, four release notes files, a logo and a favicon, and directories for docs, benchmarks, plugins, articles, assets and a Claude plugin manifest. There is no source directory, no package manifest of its own, and no build script. GitHub still reports the primary language of this repository as Python, while the README describes the implementation as Rust with Tree-sitter inside an npm package, which is a small sign of how the metadata and the code have drifted apart. The README says where the code actually is: the official package is published on npm under the name memtrace, and installation is a global npm install. The same paragraph warns that other projects share the name and are unrelated, and it tells you to compare the version the tool prints with the stable and nightly release history on the project's own site. A name collision in a tool that indexes source code is a supply-chain question rather than a documentation one, and GitHub reports the license of this repository as undetected even though a license file sits in the root, so read that file yourself. The description also names the editors it is meant to serve, Cursor, Claude Code, Codex, DeepSeek Harness, Hermes, VS Code and Windsurf, and calls the protocol MCP-native, so the integration surface is wider than the two installation paths the README spells out. The project has 487 stars, 47 forks and 5 open issues, and its last push was on 2026-10-01. That is a small issue count for a repository of this kind, and it is consistent with a codebase that is not here.
Published releases and the files in the root use two version schemes
The published releases and the documentation in the repository do not share a numbering scheme, and that is worth knowing before you file anything. The three GitHub releases are 1.2.6, 1.2.7 and 1.2.8, published in mid and late September 2026. The files in the root are named for a different series entirely: benchmark reports for 0.3.22 and 0.3.29, release notes for 0.3.85, 0.3.89, 0.4.0 and 0.4.62. The feature text points at the same older series, describing the LeanCTX Native work as available from 0.3.57 onwards, and the detailed benchmark breakdowns it links are the two 0.3.x files. So the newest published tag and the newest document in the repository are a whole major version apart, and the README resolves the confusion by sending you to the changelog on the website and to the version command rather than to the files. If you are writing an issue, quote the version the tool prints, not a file name, and expect a maintainer to ask which one you mean.
Access is a waitlist; installation is a single npm command
The barrier to using this tool is not technical. The README says plainly that it is in private beta, that access is being rolled out in batches, and that each cohort gets a Discord channel where fixes ship from real bug reports inside a week. The waitlist is on the project's own site. For people who already have access, the install is one command, given inline in the README:
npm install -g memtraceThe DeepSeek Harness path is spelled out in two steps, because the harness has to exist first. That is the dsh command, installed globally from the deepseek-ai scope, and then the plugin is added through the harness itself:
npx -y @deepseek-ai/dsh plugin --profile web add github:syncable-dev/dsh-plugin-memtraceAfter that the README asks you to have the agent index the workspace and then pull a blast radius, an evolution view or an architecture briefing. Support runs through issues on this repository, and the README asks for your operating system, your version and the exact error, with credentials and private source stripped out of any log you attach. That is a sensible support policy and a useful reminder that index dumps of a real repository can contain more than you intend to publish.
Nothing leaves the machine except counts, a licence check and crash telemetry
The privacy claim is the most specific paragraph in the README, and it is worth reading closely because one of the three items is not optional. The tool runs entirely on your machine and source code never leaves it. The network traffic it admits to is license validation, aggregate node and edge counts, and opt-out crash telemetry, and the README states that no source, no file paths and no symbol names are included in any of them. Two documents in the root, one on privacy and one on telemetry, are supposed to carry the detail. The switch is a single environment variable, written inline as MEMTRACE_TELEMETRY set to off. So the accurate reading is that indexing is local and always will be, while the licence check is a network round trip you cannot turn off. For a tool in private beta that is a normal arrangement, and for a tool you point at a proprietary repository it is the one thing to confirm with your own legal or security people, because the aggregate counts still describe the size and shape of your codebase.
The benchmark table names its rivals, and states how the ground truth was made
Most comparison tables in this category compare a product to nothing. This one does not, and it also explains the method in three lines: same machine, same corpora, same adapter contract, with ground truth taken from Python's own ast module and the pyright language server rather than from any tool's index, on the stated grounds that no system should get a home-field advantage. The numbers then follow. Indexing 1,500 files is given as 1.5 seconds and no API cost, against 31 minutes and 10 to 50 dollars for a memory product. Graph caller recall on a Django codebase is 81.6% against 5.3% for GitNexus, and a hybrid query over 3,000 Django cases is 73.9% against 38.6%. Incremental re-index at the 95th percentile is 42.5 ms against 613.7 ms for a competing grapher. Memory per process is 26 MB against 1,060 MB for a vector database. Read the one row where the lead does not hold: exact symbol accuracy is 96.6% against 97.0%, so the claim is about latency, not accuracy, and the table is honest about the difference.
Bi-temporal is the claim, and the incremental re-index number is what backs it
The positioning is against two named tools, GitNexus and CodeGrapherContext, and the objection to both is that they answer what is in the repository right now. The three headline claims frame the same idea from three directions: run a fleet of coding agents on one repository without collisions over shared context, replay a refactor with full causal awareness instead of discovering afterwards that tests nobody saw had broken, and index a 50,000-file repository in under 90 seconds. The addition is a second time axis: every symbol carries its full version history, and six scoring algorithms sit on top of it, named impact, novelty, recency, directional, compound and overview, so an agent can ask what changed, what is unexpected, or what is about to break. The third piece is cross-service topology, mapping HTTP call graphs between repositories so an agent can see which service calls which endpoint. Underneath, the structural layer is the ordinary one: symbols such as functions, classes, interfaces, types and endpoints as nodes, with typed relationships between them as edges. What the history costs is the thing to check, because keeping a version per symbol means the index is not a one-shot artifact. The 42.5 ms incremental re-index figure is the number that makes the claim plausible, and the incremental update is also what the changelog keeps touching.
Zero LLM calls, twenty languages in one place and sixteen in another
Two claims in this README sit next to each other without being reconciled, and a third contradicts itself. The repository description and the feature list both say zero LLM calls, and the indexing bullet says the implementation is Rust with Tree-sitter, fully local, with no API cost. Then the LeanCTX Native section adds four compression modes on a source window call, single-call directory maps, a token-savings dashboard, and an opt-in adaptive learner that the README says beats a static table by about 14 percent, with the breakdown in a document under docs. Those two can coexist, since a local learner needs no model, but the README does not say which it is, and that document is where the question gets answered. The language count is the simpler problem: the feature list says 20 or more languages plus framework-aware scanners for named targets including Terraform and row-level security policies, while the benchmark table reports 16 or more via Tree-sitter. Two numbers for the same capability in one document is a small thing to fix and a useful signal about how carefully the rest of the table was checked.
Editorial conclusion
Read this repository as the documentation and support surface for a closed binary, which is exactly what it is. It is worth your time for two things: the benchmark suite, which names its rivals and states how the ground truth was produced, and the bi-temporal model, which is a real answer to a question an AST graph cannot take. Before you install anything, settle three things. Access is a waitlist, not a download, and the README is clear that the tool is in private beta. The license is reported as undetected even though a license file sits in the root, so check that file yourself rather than trusting the badge. And the version numbers disagree with each other, so the only reliable identifier is the one the tool prints. If you need a code index you can read, patch and vendor, this is not that, and the two competitors named in its own table may serve better.
Frequently asked questions
What does Memtrace actually index?
It builds a knowledge graph of your codebase: every function, class, call edge and version, kept across sessions, with symbols as nodes and typed relationships as edges, including interfaces, types and endpoints. The README frames it as a bi-temporal graph, so the index carries history as well as current state.
How do I install Memtrace, and where does the code live?
Not in this repository: the root holds docs, benchmarks, plugins, release notes and a changelog file, with no source directory. The tool is published on npm and installed globally with npm install -g memtrace, and access is still gated behind a private beta waitlist on the project's site.
Does Memtrace send my source code anywhere?
The README says it runs entirely on your machine and that source never leaves it. The network traffic it admits to is license validation, aggregate node and edge counts, and opt-out crash telemetry, with no source, no file paths and no symbol names in any of them, and telemetry can be turned off with MEMTRACE_TELEMETRY=off.
How does Memtrace compare with GitNexus?
According to the table in the README, on a Django codebase Memtrace reports 81.6% graph caller recall against 5.3% and 73.9% hybrid accuracy over 3,000 cases against 38.6%, while on exact symbol queries GitNexus is marginally ahead at 97.0% against 96.6%, with Memtrace answering in 0.07 ms rather than 8.95 ms. The benchmark suite in the repository folder is the place to check the method behind those figures.
Official sources
Add this badge to your README
If you maintain this project, the badge below links readers to this analysis and shows its maintenance status from the daily GitHub snapshot. Paste the markdown into your README; add ?metric=license or ?metric=stars to the image URL for a different field.

[](https://hysenlabs.com/projects/syncable-dev-memtrace-public)Star history chart for your README
[](https://hysenlabs.com/projects/syncable-dev-memtrace-public)Was this useful?