dplyr's five verbs, its backend packages, and what the overview leaves out
dplyr: A grammar of data manipulation
At a glance
- What is it?
- dplyr gives R programmers five single-table verbs plus a grouping key, and pushes everything larger, joins included, into separate packages or into local vignettes. This is the 1.2.1 line, installed from CRAN or from the default branch with pak.
- Who is it for?
- dplyr earns its place for anyone doing routine shaping of data frames in R: five verbs with one meaning each, a grouping key that composes with all of them, and an install that takes one call. The judgment for adopters is everything outside that core.
- Can I use it commercially?
- Check first. The repository uses a licence we do not classify automatically, so read its LICENSE file before any commercial use.
- Is it still maintained?
- Yes. The repository last received commits 13 days ago.
- What is it written in?
- Mainly R, according to GitHub's language statistics.
Answers come from the project's GitHub data, last synced on November 15, 2026, and from our analysis. They are not legal advice.
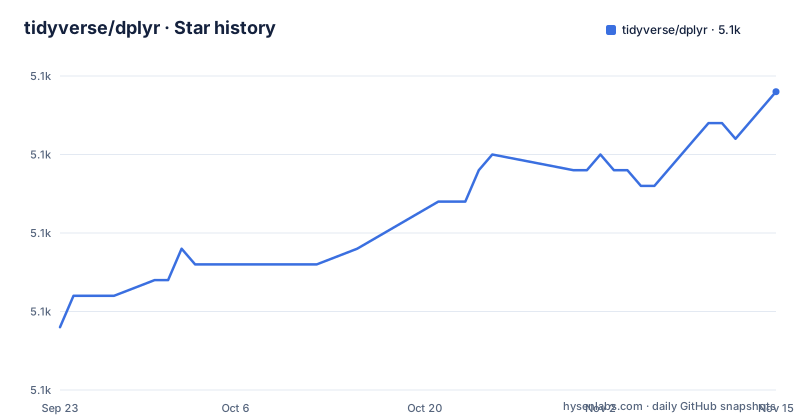
Star history
- tidyverse/dplyr5,084 ★ · +15
| Repository | 2026-09-23 | 2026-11-15 |
|---|---|---|
| tidyverse/dplyr | 5.1k | 5.1k |
15 Stars in the last 53 days, measured from the daily GitHub snapshot. Compare with other projects
Editorial analysis
Five verbs cover the data frame, and the joins live in a vignette
Five verbs carry the single-table work, and each gets a single sentence in the overview. `mutate()` adds new variables that are functions of existing variables. `select()` picks variables based on their names. `filter()` picks cases based on their values. `summarise()` reduces multiple values down to a single summary. `arrange()` changes the ordering of the rows. `group_by()` sits underneath all of them and lets any of that work happen by group. What is missing from that list is the joining half of the package. dplyr also ships two-table verbs, and the only place they are named is `vignette("two-table")`, with the single-table set in `vignette("dplyr")`. So the overview hands you the entire data frame vocabulary in five lines and sends you to a local document for everything that needs two tables. Keep that in mind when judging the package on its front page: combining tables is where the reading starts, and no join appears there at all.
The starwars example returns a tibble and stops mid-row
The single worked example pipes the built-in `starwars` data set through a filter and prints the result:
library(dplyr)

starwars |>
  filter(species == "Droid")
#> # A tibble: 6 × 14
#>   name   height  mass hair_color skin_color  eye_color birth_year sex   gender
#>   <chr>   <int> <dbl> <chr>      <chr>       <chr>          <dbl> <chr> <chr>
#> 1 C-3PO     167    75 <NA>       gold        yellow           112 none  masculi…
#> 2 R2-D2      96    32 <NA>       white, blue red               33 none  masculi…
#> 3 R5-D4      97    32 <NA>       white, red  red               NA none  masculi…
#> 4 IG-88     200   140 none       metal       red               15 none  masculi…
#> 5 R4-P17
The header line reads `# A tibble: 6 × 14`, so what comes back is a tibble, and filtering on `species == "Droid"` yields six rows across fourteen columns. Under the names sits a row of type placeholders, `<chr>`, `<int>` and `<dbl>`. The first three rows carry `<NA>` in hair_color, R5-D4 has an `NA` birth_year, and the gender column is shortened with an ellipsis. One detail deserves care: the sample stops at row `5 R4-P17` with nothing printed after the name, so the block in the README is clipped and the last rows are not shown. Run it and you will see the rest. The pipe used here is the base R `|>`, so this call needs nothing from magrittr.
Each backend is a separate package with its own translator
Backends are separate packages, and the overview is explicit that dplyr on its own is not the thing reading Arrow tables or relational databases. `arrow` covers larger-than-memory data sets, including remote cloud storage on AWS S3, through the Apache Arrow C++ engine Acero. `dbplyr` covers data in a relational database and translates your dplyr code to SQL. `dtplyr` covers large in-memory data by translating to data.table code, and `duckplyr` does the same job by translating to duckdb queries with zero extra copies. `sparklyr` covers very large data sets held in Apache Spark. Every entry there is an extra install plus a translation layer, which means the verbs you can actually use depend on whether that backend's translator covers the call you wrote. Only one of the five names a safety net: duckplyr documents an automatic R fallback when translation is not possible. For the other four, nothing is said about what happens to an expression that cannot be translated, so read the backend's own pages before depending on an exotic verb.
The development version installs straight from the default branch
Two lines cover a normal install, and a third path exists for people who want code that has not shipped:
# The easiest way to get dplyr is to install the whole tidyverse:
install.packages("tidyverse")

# Alternatively, install just dplyr:
install.packages("dplyr")# install.packages("pak")
pak::pak("tidyverse/dplyr")The first block is the choice between the whole tidyverse and this package on its own. The second is the development version, pulled from GitHub through pak, and the commented line above it is the step that makes pak available. Because that path points at the repository and its default branch rather than at a tag, the development install gives you work that has not been versioned or announced. The newest release is dplyr 1.2.1, while the branch carries whatever landed after it. That is the trade the overview names outright: a bug fix or a feature ahead of CRAN, in exchange for an install nobody has frozen.
README.md is generated, so hand edits get overwritten
The top level is an R package laid out the conventional way: `DESCRIPTION`, `NAMESPACE`, `R/`, `src/`, `man/`, `tests/`, `vignettes/`, `data/`, `data-raw/`, plus `dplyr.Rproj` for RStudio and `air.toml` for formatting. Two entries have consequences for anyone working from the GitHub copy. First, the README opens with a generated notice: it says the file is generated from `README.Rmd` and asks that the Rmd be edited instead, so a patch touching README.md by hand edits a file the build overwrites. Second, two license files sit side by side, `LICENSE` and `LICENSE.md`, and the license field on the repository does not resolve to a recognized identifier, so read both before copying either into your own project. A `revdep/` directory is present as well, and nothing here explains what runs it.
Bugs go to the tracker with a reproducer, questions go to a forum
Support is split by problem type. A clear bug goes to the GitHub issue tracker with a minimal reproducible example attached; questions and other discussion go to forum.posit.co instead. Documentation comes in two shapes. Two vignettes are named in the overview, `vignette("dplyr")` for the single-table verbs and `vignette("two-table")` for the joining ones, and both ship inside the installed package, so they work offline. The rest lives on the site at dplyr.tidyverse.org, which this repository also builds through `_pkgdown.yml` and the `pkgdown/` directory. The cheat sheet is the exception: it is a PDF hosted in the rstudio/cheatsheets repository rather than this one, so it can change without a release here.
More than two years separate 1.1.4 from 1.2.0
Release timing is uneven, and the dates are worth having in your head. dplyr 1.1.4 shipped 2023-11-17. The next listed release, 1.2.0, is dated 2026-02-04, and 1.2.1 followed on 2026-04-03. The last push to the repository was 2026-11-02, so commits exist on the branch that belong to no release. Two consequences follow. A jump from 1.1.4 to 1.2.0 is a minor version bump across a long gap, and that is where behaviour changes arrive, so an update deserves a check against your own results rather than a routine pull. And because the pak install pulls that same branch, a development install is always at least as new as the newest tag, sometimes much newer. The top level has a `NEWS.md` for reading what changed between versions; its contents are not reproduced on this front page.
Editorial conclusion
dplyr earns its place for anyone doing routine shaping of data frames in R: five verbs with one meaning each, a grouping key that composes with all of them, and an install that takes one call. The judgment for adopters is everything outside that core. The joining verbs appear only inside a vignette, each backend is a separate package whose translator decides which verbs work, and the license text sits in two files with no resolved identifier on the repository. Before upgrading from 1.1.4, read NEWS.md for that version's behaviour changes, keep SQL and Arrow work on dbplyr and arrow rather than expecting dplyr to reach a database on its own, and treat the pak development install as a branch install rather than a release.
Frequently asked questions
How do I install dplyr in R?
Two calls are given: install.packages("tidyverse") for the whole collection, or install.packages("dplyr") for this package alone. For a bug fix or a feature ahead of CRAN, install the development version from GitHub with pak::pak("tidyverse/dplyr"), which pulls the default branch rather than a release.
How do I use dplyr in R?
The worked example loads the package, then pipes the built-in starwars data set into filter() and prints the result: starwars |> filter(species == "Droid"). The printed header in that example is a tibble of 6 rows and 14 columns, and the pipe shown is the base R one.
How do I use dplyr filter?
filter() picks cases based on their values. In the usage example it is called as filter(species == "Droid") on the starwars data set, and it composes with group_by() so the same filter can run by group.
How do I use dplyr select?
select() picks variables based on their names, so you choose columns rather than rows. Like the other single-table verbs, it combines with group_by() and is documented alongside them in vignette("dplyr").
How do I use dplyr mutate?
mutate() adds new variables that are functions of existing variables, so a column is computed from the columns already in the data. The README names it first among the five single-table verbs that also work by group through group_by().
What does %>% do in dplyr?
The usage example pipes with the base R |>, not with the magrittr operator, so that call needs no extra package. The front page never shows %>%.
Official sources
Add this badge to your README
If you maintain this project, the badge below links readers to this analysis and shows its maintenance status from the daily GitHub snapshot. Paste the markdown into your README; add ?metric=license or ?metric=stars to the image URL for a different field.

[](https://hysenlabs.com/projects/tidyverse-dplyr)Star history chart for your README
[](https://hysenlabs.com/projects/tidyverse-dplyr)Was this useful?