ggtree: drawing phylogenetic trees as ggplot2 layers with annotation data attached
:christmas_tree:Visualization and annotation of phylogenetic trees
At a glance
- What is it?
- ggtree is an R package that extends ggplot2 to tree-like structures, so a phylogenetic tree becomes a set of layers that annotation data can be layered onto. It is a Bioconductor package with no GitHub releases, and its licensing terms are not stated in the repository.
- Who is it for?
- ggtree suits an analyst who already works in ggplot2 and needs a tree plot that carries branch annotations, tip labels and external data without leaving R. It does not suit a reader who needs a documented licence grant or a self-contained install script, since the licence field for the repository carries no identifier and the README does not state the terms.
- Can I use it commercially?
- Not without permission. GitHub finds no licence file in the repository, and without a licence all rights are reserved by default: you may read the code but not reuse it. Check the README, or ask the authors, before using it.
- Is it still maintained?
- Yes. The repository last received commits 10 days ago.
- What is it written in?
- Mainly R, according to GitHub's language statistics.
Answers come from the project's GitHub data, last synced on November 7, 2026, and from our analysis. They are not legal advice.
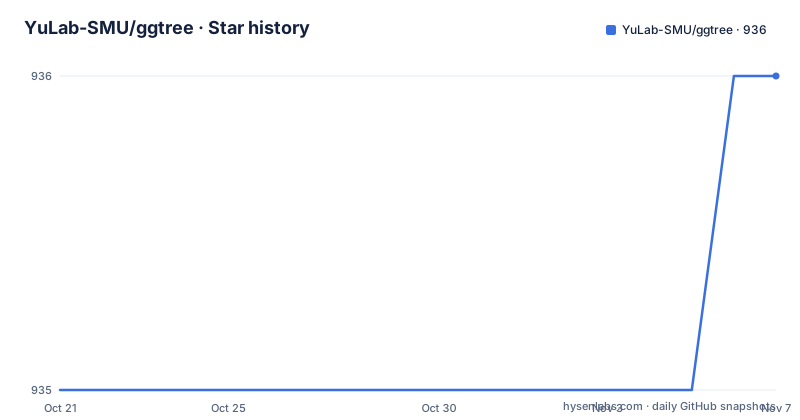
Star history
- YuLab-SMU/ggtree936 ★ · +1
| Repository | 2026-10-21 | 2026-11-07 |
|---|---|---|
| YuLab-SMU/ggtree | 935 | 936 |
1 Stars in the last 17 days, measured from the daily GitHub snapshot. Compare with other projects
Editorial analysis
A tree becomes a set of plot layers rather than a drawing
ggtree is an R package for the visualization and annotation of phylogenetic trees and other tree-like structures with their annotation data, and the way it achieves that is by extending ggplot2, the plotting system that implements the grammar of graphics. The README puts it plainly: ggtree extends ggplot2, and it is designed for visualization and annotation of phylogenetic trees and other tree-like structures with their annotation data. The consequence for a user is that the tree is not a picture produced by a bespoke layout engine with its own options. It is built from layers, and the annotation data is attached to the tree as data rather than drawn beside it. That is the design decision that matters for anyone choosing between plotting approaches: in ggtree the tip labels, the branch lengths, the confidence annotations and whatever you measured per tip all live in one object, and the graphic is a projection of that object.
The tree and its annotations travel as one serialized data object
The published method paper describes ggtree as providing a serialized data object for visualization of a phylogenetic tree and annotation data, and that framing is the real contribution rather than the drawing itself. A tree has structure: tips, internal nodes, branches with lengths, and a topology that a layout has to solve. Annotation data has a different shape: one row per tip, or per branch, with arbitrary columns. ggtree's contribution is to make those two things share a single object so that the mapping between a measurement and the place it is drawn on the tree is data rather than bookkeeping in a plotting script. That is what allows a tip label, a heat map strip, a symbol and a colour to be specified in the same pipeline that produced the topology. The second method paper by the same group covers two methods for mapping and visualizing associated data on phylogeny using ggtree, and the author's book covers data integration and manipulation for phylogenetic trees more broadly, so the design is documented as a method rather than as a plotting convenience.
Bioconductor versioning, not GitHub tags, is what you track
This repository publishes no GitHub releases at all, and that is not an oversight. ggtree is a Bioconductor package, and the badges in the README point at Bioconductor for the platform status and for the release version, which reads 3.16.3 for the current release line while the availability badge tracks the devel branch. The Makefile makes the release mechanics visible: it reads the package name and version out of the DESCRIPTION file, and the version variable is set from git describe --tags, so tags in the repository are the input to the build number. It also holds a BIOCVER variable set to RELEASE_3_23 and a release target that checks out that branch, which is the standard Bioconductor pattern where a release branch is frozen and the devel branch carries new work. The tree has the other Bioconductor furniture too, with a DESCRIPTION file, a NAMESPACE, an R directory, a man directory, tests and vignettes, and a NEWS file plus a NEWS.md. For a user, the practical consequence is that you install ggtree through Bioconductor and let its release cycle set the version, not from a tagged GitHub archive.
Building and checking the package yourself, using the Makefile
The repository ships a Makefile that documents the development loop precisely. Documentation is generated with roxygen2, the README is rendered from README.Rmd with rmarkdown, and the package is built with devtools::build() or, in a second variant, with R CMD build and the vignettes skipped. Installation from the built tarball uses R CMD INSTALL on a package tarball named after the package and version. Checking happens through devtools::check(), with variants that run the package's do-not-run tests via rcmdcheck and the --run-dontrun argument, a variant that runs R CMD check while ignoring vignettes, and a BiocCheck target that runs BiocCheck against the tarball. The release target chains a check that does not run the long tests, a clean and a README render. These commands are the actual reference for how the package is put together and how it is validated.
The build and check commands the Makefile uses look like this:
Rscript -e 'roxygen2::roxygenise(".")'
Rscript -e 'devtools::build()'
Rscript -e 'devtools::check()'
A stricter pass that also runs the long tests and a Bioconductor-specific check:
Rscript -e 'rcmdcheck::rcmdcheck("$(PKGNAME)_$(PKGVERS).tar.gz", args=c("--run-dontrun"))'
Rscript -e "BiocCheck::BiocCheck('$(PKGNAME)_$(PKGVERS).tar.gz')"
What the package cannot do, and where it stops
The repository is honest about its scope, and the limits are worth reading before you commit to it. The README describes the package as covering visualization and annotation of phylogenetic trees and other tree-like structures, which is a broad phrase, but it is a visualization and annotation tool. It is not a phylogenetic inference package, it does not compute trees, and it does not replace the alignment and model selection work that produces the topology in the first place. The other limit is version coupling. Because the package is versioned against Bioconductor releases and its dependencies move with them, an analysis script written against one Bioconductor version can break on the next one, and the vignettes and tests are the place where those changes surface. The README also carries a link to the contribution tree data page, which is where the author teaches this family of methods interactively, so the teaching content sits alongside the package rather than inside it.
Citation expectations come with the package, and so does a licence gap
The licence field for the repository carries no identifier, which is unusual and worth flagging before anyone adopts this in a commercial or institutional setting. The README does not state licence terms at all, and the tree listing shows no LICENSE file, only a CONDUCT.md for the code of conduct and CONTRIBUTING.md and CONTRIBUTORS.md. That is a documentation gap rather than a restriction, since the package is distributed through Bioconductor where terms are stated separately, but anyone republishing the code or bundling it into another product needs to resolve the question themselves. The other administrative item is explicit: the README asks that if you use ggtree in published research you cite the most appropriate paper from a list of five, starting with the iMeta paper on the serialized data object from 2022, then the author's CRC book on data integration and visualization of phylogenetic trees, the Current Protocols in Bioinformatics article on using ggtree to visualize data on tree-like structures, and two earlier methods papers.
How ggtree differs from plain tree drawing in R
The comparison worth making is with the other two common routes to a tree figure in R. The first is ape, which is the underlying tree representation many analysis packages produce and which can draw a phylogeny with its own plot method; it draws a tree, but the drawing is its own function rather than a composition of grammar of graphics layers, so overlaying your own annotation means custom code. The second is a generic graph or network drawing package, where a tree is just a graph layout; you get a picture but you lose the semantics of nodes and branches. ggtree sits between them. It keeps the tree semantics, including tips, internal nodes and branch lengths, and expresses the picture as ggplot2 layers so that annotation data, heat maps, symbols and labels are drawn on the same coordinate system as the tree itself. The cost of that design is the ggplot2 learning curve and the fact that ggtree is not a standalone tool: it expects the tree to already exist in R and it expects you to be comfortable with layer specifications.
Editorial conclusion
ggtree suits an analyst who already works in ggplot2 and needs a tree plot that carries branch annotations, tip labels and external data without leaving R. It does not suit a reader who needs a documented licence grant or a self-contained install script, since the licence field for the repository carries no identifier and the README does not state the terms. Before you depend on it, check the DESCRIPTION file for the licence field and the Bioconductor release you are on, because the package follows Bioconductor versioning rather than GitHub tags, and confirm that your tree and annotation objects survive a round trip through the ggtree data model before building a figure pipeline on top of them.
Frequently asked questions
How do I install ggtree?
ggtree is distributed through Bioconductor rather than as a GitHub release, and the README badge tracks the Bioconductor release version, which reads 3.16.3 for the current line. The repository publishes no GitHub releases of its own.
What does ggtree add on top of ggplot2?
ggtree extends ggplot2 to tree-like structures, so a phylogenetic tree is represented as layers and its annotation data is attached to that tree as data. The published method paper describes it as a serialized data object for visualization of a phylogenetic tree and annotation data.
Does ggtree compute phylogenetic trees?
No. The package is for visualization and annotation of phylogenetic trees and other tree-like structures, so the topology has to be produced elsewhere and passed in. The README points to the contribution tree data page for the wider method.
What licence does ggtree use?
The licence field for the repository carries no identifier and the README states no terms, so the repository itself does not tell you. Since the package is distributed through Bioconductor, check the package listing there for the terms that apply to the version you install.
Official sources
Add this badge to your README
If you maintain this project, the badge below links readers to this analysis and shows its maintenance status from the daily GitHub snapshot. Paste the markdown into your README; add ?metric=license or ?metric=stars to the image URL for a different field.

[](https://hysenlabs.com/projects/yulab-smu-ggtree)Star history chart for your README
[](https://hysenlabs.com/projects/yulab-smu-ggtree)Was this useful?