MemLab: finding JavaScript memory leaks with heap snapshot diffs
A framework for finding JavaScript memory leaks and analyzing heap snapshots
At a glance
- What is it?
- MemLab is a Meta open source framework that drives a Chrome page through a Puppeteer scenario, diffs heap snapshots, and prints retainer traces for leaked objects. It also ships a heap analysis CLI and an MCP server for AI coding assistants.
- Who is it for?
- Adopt MemLab if you already have a Chromium-based page or a Node.js process whose heap you can snapshot, and you want retainer traces rather than a raw snapshot viewer. Skip it if you need continuous production monitoring or your code is minified beyond readable names, because the README states the trace needs non-minified code or at least readable variable, function, and property names.
- Can I use it commercially?
- Yes. MIT is a permissive licence: you can use, modify and sell software built on it, as long as you keep its copyright and licence notices.
- Is it still maintained?
- Yes. The repository last received commits 1 day ago.
- What is it written in?
- Mainly TypeScript, according to GitHub's language statistics.
Answers come from the project's GitHub data, last synced on November 14, 2026, and from our analysis. They are not legal advice.
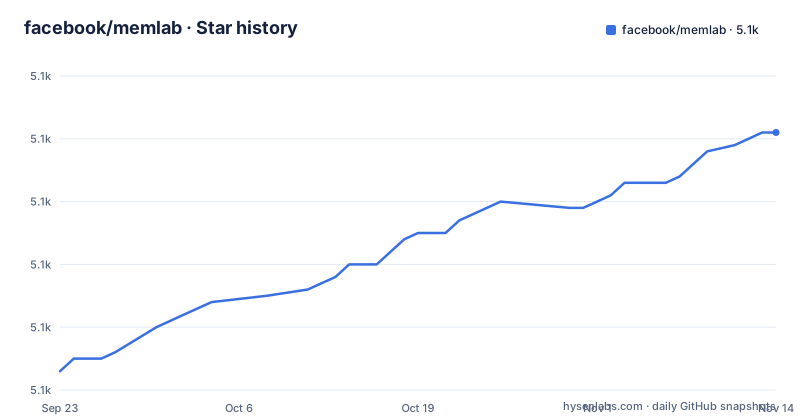
Star history
- facebook/memlab5,091 ★ · +38
| Repository | 2026-09-23 | 2026-11-14 |
|---|---|---|
| facebook/memlab | 5.1k | 5.1k |
38 Stars in the last 52 days, measured from the daily GitHub snapshot. Compare with other projects
Editorial analysis
The problem MemLab targets: leaks that only show up after an interaction
A heap snapshot tells you what is in memory. It does not tell you which of those objects should have been freed after a user clicked a button, closed a dialog, or navigated back. That comparison is the gap MemLab fills. The README describes it as an end-to-end testing and analysis framework for identifying JavaScript memory leaks and optimization opportunities, and the unit of work is a scenario: a page URL, a forward action, and a back action that returns the page to roughly its previous state. If memory is still held after the back action, something retained it.
The audience is narrow but real. You need a page or process you can drive programmatically, and you need to be able to rebuild it without minification. Front-end teams debugging a single-page app that grows across navigation, and Node.js or Electron developers who want a memory assertion inside a test, are the two groups the repository layout points at: packages/e2e for the browser driver, packages/core for the heap graph, packages/heap-analysis for the built-in analyses, and packages/mcp-server for the AI assistant integration. The README does not claim MemLab finds every leak. It aggregates clusters and shows one representative retainer trace per cluster.
How the scenario, the heap graph, and the leak filter fit together
The mechanism is a three-step loop. MemLab loads the URL, runs the action, returns with back, and compares the JavaScript heap snapshots it takes along the way. Objects allocated by the interaction that are still reachable from the GC root after the back action become leak candidates. The README's example output shows this as a count ("MemLab found 46 leak(s)"), a retained size per cluster, and a retainer trace: an object reference chain from the GC root down to the leaked object, with the edge type and the object id at each hop.
The retainer trace is the part worth understanding. Each line names a node, its type, its id, and its retained size, and each arrow names the edge that keeps the child alive. Breaking any one edge in that chain means the object is no longer reachable and can be collected. That is why MemLab is more useful than a snapshot viewer for this task: it hands you a specific reference to set to null.
When the built-in detectors are wrong for your case, the scenario file accepts a leakFilter callback that is called for every unreleased heap object allocated by the target interaction. Returning true marks the node as a leak. The second argument is the graph representation of the final snapshot, so a custom detector can walk retainers itself.
Installing MemLab and running a first leak scenario
The CLI is published on npm and the README gives a single global install command. The root package.json carries an error script whose message reads 'upgrade node.js to version 16.0.0 or above'.
npm install -g memlabA scenario is a plain JavaScript module exporting url, action, and back. The README's example targets Google Maps, clicks the Hotels button, and closes the search panel to return to the prior state. Both action and back receive a Puppeteer page object, so any Puppeteer selector works.
function url() {
  return 'https://www.google.com/maps/@37.386427,-122.0428214,11z';
}

async function action(page) {
  await page.click('text/Hotels');
}

async function back(page) {
  await page.click('[aria-label="Close"]');
}

module.exports = {action, back, url};
Run it by pointing the CLI at the file. You should see a leak count, the number of similar leaks in the run, the retained size, and one retainer trace per cluster.
memlab run --scenario test-google-maps.jsIf you already have a snapshot instead of a live page, view-heap opens it interactively, and --node-id pins a specific object. Snapshots taken by a run are stored under the default work directory, which you can locate with memlab get-default-work-dir, in the data/cur subdirectory.
memlab view-heap --snapshot <PATH TO .heapsnapshot FILE>Where MemLab stops being the right tool
The README is explicit about one hard limit: to get a readable retainer trace, the site under test needs to serve non-minified code, or at least minified code with readable variable, function, and property names. A production bundle that mangles names produces a trace of anonymous closures, which is close to useless for locating the bug. That single constraint rules out pointing MemLab at a live production URL and expecting an actionable answer.
The second limit is scope. MemLab compares snapshots taken around a scripted interaction. It is not a profiler and not a long-running monitor. If your leak only manifests after an hour of real user behavior, a scenario that clicks one button twice will not reproduce it.
Third, the comparison is only as good as the back action. If back does not actually return the page to a comparable state, the diff is measuring your scenario, not your leak. Treat the back function as test code that needs its own review.
MemLab against Chrome DevTools and the Node.js inspector
The obvious alternative is the tooling you already have: Chrome DevTools' Memory panel for browser heaps, and the Node.js inspector's heap snapshot support for server processes. Both take snapshots and both let you search retainers. The difference is who does the comparison. DevTools expects a human to take two snapshots, switch to the comparison view, and read the delta by eye. MemLab automates that loop and reduces the result to clusters with a representative trace, which is why the README frames it as end-to-end testing rather than debugging.
A second alternative is writing the assertion yourself against the V8 heap snapshot format. That is possible, and the README notes MemLab accepts .heapsnapshot files from Chromium, Node.js, Electron.js, and Hermes, so the format is the common ground. What you would be rebuilding is the object-oriented traversal API and the built-in analyses such as memlab analyze unbound-object, which reports objects that keep growing in size across an interaction. The trade-off is real in both directions: DevTools needs no install and no scenario file, while MemLab needs a scenario but gives you a repeatable check.
Maintenance, licence, and what an upgrade costs
The repository is not archived and the last push was on 2026-11-02, so the project is being worked on. The repository has no published GitHub releases, so check the npm package page for the current version before pinning one.
The licence is MIT, declared both in the README badge and in the root package.json. That is a permissive licence, but this is not legal advice; if you redistribute MemLab inside a product, read the LICENSE file at the repository root yourself.
Upgrade cost is mostly the Node.js version floor and Puppeteer. The root package.json pins puppeteer at 24.31.0 and requires Node.js 16 or above, and the scenario API is Puppeteer's page API, so a Puppeteer major bump can reach your scenario file. The monorepo publishes packages/core, packages/lens, packages/e2e, packages/heap-analysis, packages/api, packages/cli, packages/memlab, and packages/mcp-server as workspaces; if you consume the memlab npm package rather than the CLI, the README shows a require('memlab') entry point for starting an E2E run in code.
Editorial conclusion
Adopt MemLab if you already have a Chromium-based page or a Node.js process whose heap you can snapshot, and you want retainer traces rather than a raw snapshot viewer. Skip it if you need continuous production monitoring or your code is minified beyond readable names, because the README states the trace needs non-minified code or at least readable variable, function, and property names. Before committing, verify that memlab run --scenario works against your own page and that the leaked object IDs it prints can be opened in Chrome DevTools from $(memlab get-default-work-dir)/data/cur.
Frequently asked questions
How do you use MemLab to find a memory leak?
Write a scenario file exporting url, action, and back, then run memlab run --scenario <file>. MemLab loads the page, performs the action, returns with back, compares heap snapshots, and prints one representative retainer trace per cluster of leaked objects.
How do you install the MemLab CLI?
The README gives npm install -g memlab as the install command. The root package.json carries an error script whose message says to upgrade Node.js to version 16.0.0 or above.
What does memlab analyze do?
It runs built-in memory analyses over a previous run or over pre-fetched snapshots. The README shows memlab analyze unbound-object to see which object keeps growing in size during an interaction, and notes that --snapshot-dir can point at a directory of .heapsnapshot files.
Can MemLab read a heap snapshot without running a browser?
Yes. memlab view-heap --snapshot <PATH TO .heapsnapshot FILE> opens a single snapshot taken from Chromium, Hermes, memlab, or any Node.js or Electron.js program, and --node-id can pin a specific object by its id.
Official sources
Add this badge to your README
If you maintain this project, the badge below links readers to this analysis and shows its maintenance status from the daily GitHub snapshot. Paste the markdown into your README; add ?metric=license or ?metric=stars to the image URL for a different field.

[](https://hysenlabs.com/projects/facebook-memlab)Star history chart for your README
[](https://hysenlabs.com/projects/facebook-memlab)Was this useful?