markvis keeps the table when the chart fails, and that is the whole design
Charts in Markdown. The fence is the data.
At a glance
- What is it?
- markvis reads a fenced code block tagged chart, markvis or vis, parses a header of YAML-like fields plus CSV rows, and returns an SVG. If anything is wrong with the block, the parse result carries the table and a stable error code instead of throwing, so a broken chart degrades into readable text rather than a broken page.
- Who is it for?
- Adopt markvis if your content is already Markdown and you want charts to survive as text, because the failure mode is the selling point: an invalid block renders its table and a stable error code rather than a broken page, and `npx markvis check notes.md` exits non-zero on any bad block. Do not adopt it if you need interactivity, tooltips on hover, or data sources other than literals, since no JavaScript is allowed inside the block.
- Can I use it commercially?
- Yes. MIT is a permissive licence: you can use, modify and sell software built on it, as long as you keep its copyright and licence notices.
- Is it still maintained?
- Yes. The repository last received commits 12 days ago.
- What is it written in?
- Mainly TypeScript, according to GitHub's language statistics.
Answers come from the project's GitHub data, last synced on November 7, 2026, and from our analysis. They are not legal advice.
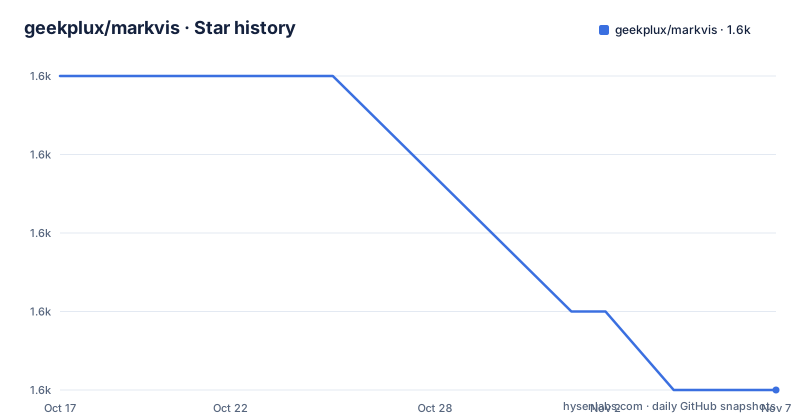
Star history
- geekplux/markvis1,595 ★ · -4
| Repository | 2026-10-17 | 2026-11-07 |
|---|---|---|
| geekplux/markvis | 1.6k | 1.6k |
-4 Stars in the last 21 days, measured from the daily GitHub snapshot. Compare with other projects
Editorial analysis
A block tagged chart, a header, and CSV rows
The whole format fits in one block. A fence is a fenced code block tagged `chart`, or `markvis`, or `vis`, and the numbers live inside it:
markvis: 2
type: bar
title: Mar led Midtown box office at 9.2k tickets
unit: tickets
x: month
y: tickets

month,tickets
Sep,5200
Oct,6100
Nov,7800
Dec,8500
Jan,4800
Feb,7200
Mar,9200
Apr,6900
The structure is a header block of `key: value` lines, a blank line, then a CSV body with a header row. The header keys are `markvis` for the version, `type`, `title`, `unit`, `x`, `y`, `series`, plus optional `theme`, `palette` and `surface`. Type-local fields exist too: `layout`, `innerRadius`, `min`, `max`, `orient` and `role`.
The stated principle is that if the chart cannot draw, you still see the table. That is the difference between this and a plotting library: the data is not an implementation detail of the renderer, it is the source text.
You can also write the numbers as a Markdown table instead of CSV, or use an HTML comment form. The repository carries both: `examples/valid/` holds working blocks, `examples/invalid/` holds ones that should fail, and `examples/hosts/` is presumably for the renderer integrations. `examples/prompts.md` is there for the AI-writing path described below.
parseMarkdown returns a result object, not a promise or a throw
The programmatic API is two functions and a discriminated result:
import { parseMarkdown, renderSvg } from "markvis";

const parsed = parseMarkdown(markdown);
if (parsed.ok) {
  const svg = renderSvg(parsed.chart);
} else {
  // parsed.table still has the rows; parsed.error.code is stable
}
Two design commitments are visible in three lines. Parsing does not throw, so a malformed block in a document with fifty other blocks cannot abort the render of the whole document. And on failure you keep `parsed.table`, so the fallback is data rather than an error message.
The error codes are stable, which is what makes the failure path testable. The README names one: text such as `N/A` in a measure cell is an error with code `E_BAD_NUMBER`, and the table stays. A blank measure cell is different, and the distinction matters: it is treated as missing, not as zero.
That last detail is the kind of thing that would otherwise be a silent data bug. An empty cell in a CSV that a plotting library reads as 0 would draw a bar of nothing; markvis treats it as an absent value.
Two other rejections are explicit. Any `markvis` version other than 2 is rejected, and you should omit the field entirely for version 2. An unknown `theme` or `palette` produces a table and an error rather than a silent substitution to a default.
Seventeen types, seven themes, five palettes, and no JavaScript
The vocabulary is deliberately closed, and the README is explicit that a bad choice is reported rather than quietly replaced.
Chart kinds: `bar`, `line`, `area`, `scatter`, `pie`, `hist`, `heatmap`, `funnel`, `waterfall`, `radar`, `gauge`, `sankey`, `treemap`, `dumbbell`, `bullet`, `boxplot`, `calendar`. Seventeen in total.
Themes describe how it is drawn: `folio` as the default, then `highcharts`, `shadcn`, `docs`, `ant`, `recharts` and `graphite`. Palettes are colors only: `ink`, `porcelain`, `warm`, `cool`, `vivid`.
Data has its own restrictions worth stating plainly. Numbers are comma-separated rows or one Markdown table, and explicitly not JSON as the default. There is no JavaScript in the block. Those three constraints give a model a restricted format to follow, which fits the project's description of a rewrite for people and for AI.
Two rendering details are specified rather than left to chance. Pie slices are not forced to 100. And rows stay in the order you wrote them, which means a sorted-looking chart is sorted by you, not by the renderer.
One field is easy to misuse: `orient: horizontal` on a bar chart is there for long category labels, not as a general layout preference.
bake writes a picture and leaves the block alone
The CLI is where this stops being a renderer and becomes a static-site workflow. Installation is:
npm install markvis
npx markvis bake README.md
`bake` writes a picture next to the file and adds a Markdown image reference so GitHub can display it. Two properties of that behaviour are what make it usable in version control. The code block stays, so the data remains diffable and reviewable. And the image reference stays pointed at the file it just wrote, so a second run updates in place rather than accumulating references.
Running bake again does nothing if nothing changed. That makes it safe in a pre-commit hook or a CI step, since it is idempotent on unchanged content rather than rewriting files every time.
The companion command is the one to run in CI:
npx markvis check notes.mdIt checks every chart block in the file and exits non-zero if any block is invalid. Combined with the stable error codes, that gives you a lint step that tells you which document and which block broke, rather than a failed build with a stack trace.
The package version is 2.1.0 and the engine floor is Node 20 or later. Version 2 replaces 0.0.13, the old d3 renderer, which stays in a `legacy/` directory for anyone still on it. That is a hard break by name, and the README treats it as one.
remark and markdown-it, both returning SVG and a table
Site integration is two adapters rather than one, and the README shows both in full:
import MarkdownIt from "markdown-it";
import markdownItMarkvis from "markvis/markdown-it";

const html = new MarkdownIt({ html: true })
  .use(markdownItMarkvis)
  .render(markdown);
// html contains <svg> and <table>import { remark } from "remark";
import remarkHtml from "remark-html";
import remarkMarkvis from "markvis/remark";
const html = String(
await remark()
.use(remarkMarkvis)
.use(remarkHtml, { sanitize: false })
.process(markdown),
);Both produce both artefacts: the SVG and the data table. That is the plugin contract, and it follows from the parse result shape.
The remark example sets `sanitize: false` on remark-html, which you should notice before copying it. If your content comes from untrusted authors, that setting is a decision with security consequences, not a formatting preference.
The markdown-it example sets `html: true`, which for the same reason permits the plugin's own output.
package.json exposes these as subpath exports: `./parser`, `./render-svg`, `./ir`, `./remark`, `./markdown-it`, `./themes`, `./cli` and a `./min` entry pointing at `dist/markvis.min.js` for a script-tag browser build. The `./ir` export in particular suggests the intermediate representation is public, which is what you would want if you needed to transform the chart model between parsing and rendering.
Where it is the wrong tool
There is no interactivity, and that is structural rather than a missing feature. Output is SVG produced at parse time, with no JavaScript allowed in the data block, so there is no tooltip on hover, no zoom, no brush, no click-through to a detail view. If your chart needs to be explored rather than read, markvis is the wrong shape and you want a charting library that ships a runtime.
There is also no data source other than literals. The block holds numbers, not a query, a URL or a file reference. So a chart of data that changes every hour has to be regenerated by re-running `bake`, which is fine in a static site with a CI step and wrong for a dashboard.
The vocabulary is closed. Seventeen chart types, seven themes, five palettes, and unknown values error rather than fall back. That is the right call for reproducibility and it is a real constraint for anyone whose charting needs exceed the list, since adding a type means changing the package rather than passing a config object.
And the rewrite is very new. The README states the 2017 version was a GitHub Trending renderer and that this is a rewrite under the same name for people and for AI. There are no GitHub releases despite package.json declaring version 2.1.0, so there is no changelog-driven upgrade history to plan against, though a `CHANGELOG.md` and `docs/release.md` exist in the repository. The last push was on 2026-10-08, so the code is moving.
The AI angle deserves a specific caveat rather than a general one. The README instructs you to point a model at `skills/markvis/SKILL.md` or `llms.txt`, telling it to write only the listed fields, not to produce a PNG, and not to invent a type id. `llms-full.txt` is also in the repository. Those files make generated blocks predictable, but a model will still produce an invalid field name occasionally, which is exactly why `npx markvis check` exists as a gate rather than as a convenience.
Editorial conclusion
Adopt markvis if your content is already Markdown and you want charts to survive as text, because the failure mode is the selling point: an invalid block renders its table and a stable error code rather than a broken page, and `npx markvis check notes.md` exits non-zero on any bad block. Do not adopt it if you need interactivity, tooltips on hover, or data sources other than literals, since no JavaScript is allowed inside the block. Before writing blocks, use the fenced block tag `chart` and include `markvis: 2` in the header, since any other version value is rejected, and treat the seventeen chart types and seven themes in SPEC.md as a fixed vocabulary rather than something to extend at the call site.
Frequently asked questions
How do I write a markvis chart block?
Use a fenced code block tagged `chart`, `markvis` or `vis`. Inside, put `markvis: 2` plus `type`, `title`, `unit`, `x` and `y` or `series`, then a blank line, then comma-separated rows with a header row. SPEC.md documents every field.
What happens when markvis cannot render a chart?
Parsing does not throw. `parseMarkdown` returns a result with `ok` false, `parsed.table` still containing the rows, and a stable `parsed.error.code` such as `E_BAD_NUMBER` for text like `N/A` in a measure cell. A blank cell is treated as missing rather than zero.
How do I use markvis in a Markdown site?
Either adapter works. With markdown-it, `new MarkdownIt({ html: true }).use(markdownItMarkvis).render(markdown)`. With remark, chain `.use(remarkMarkvis)` and `.use(remarkHtml, { sanitize: false })`. Both return HTML containing the SVG and the data table.
What is the difference between markvis 2 and 0.0.13?
Version 2 replaces 0.0.13, the old d3 renderer, which remains available in the `legacy/` directory. The npm package `markvis` is now 2.x, and a block declaring any `markvis` version other than 2 is rejected.
Can a markvis block contain JSON or JavaScript?
JSON is not the default. Numbers are given as comma-separated rows or as one Markdown table, and no JavaScript is allowed inside the block.
Official sources
Add this badge to your README
If you maintain this project, the badge below links readers to this analysis and shows its maintenance status from the daily GitHub snapshot. Paste the markdown into your README; add ?metric=license or ?metric=stars to the image URL for a different field.

[](https://hysenlabs.com/projects/geekplux-markvis)Star history chart for your README
[](https://hysenlabs.com/projects/geekplux-markvis)Was this useful?