leafmap exists because Google Earth Engine needs a cloud account
A Python package for interactive mapping and geospatial analysis with minimal coding in a Jupyter environment
At a glance
- What is it?
- leafmap is a Python package for interactive mapping and geospatial analysis inside a notebook, built as a spin-off of geemap for people who cannot use Google Earth Engine. It wraps folium, ipyleaflet, WhiteboxTools and ipywidgets behind one API, ships ten optional dependency groups, and installs eleven extras-heavy pip requirements on a Python 3.9 floor.
- Who is it for?
- leafmap suits an analyst who wants an interactive map and a processing toolset inside Colab, JupyterLab or marimo without writing glue code, and it suits a teacher who needs a GUI rather than an API. It does not suit a pipeline that has to run headless with no notebook in the loop, since the package is designed around the notebook front end.
- Can I use it commercially?
- Yes. MIT is a permissive licence: you can use, modify and sell software built on it, as long as you keep its copyright and licence notices.
- Is it still maintained?
- Yes. The repository last received commits 2 days ago.
- What is it written in?
- Mainly Python, according to GitHub's language statistics.
Answers come from the project's GitHub data, last synced on November 14, 2026, and from our analysis. They are not legal advice.
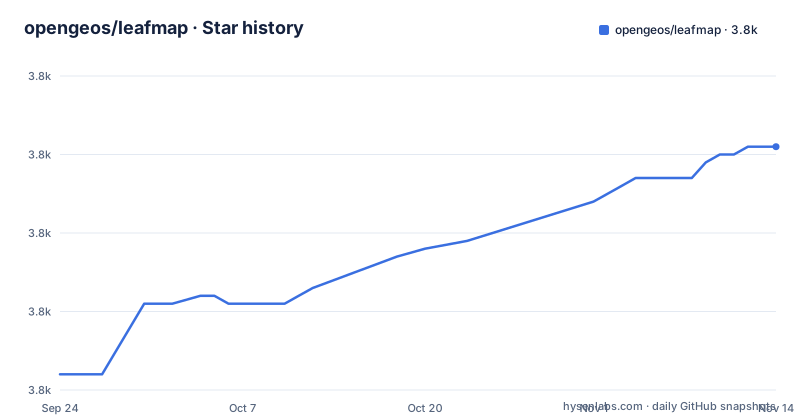
Star history
- opengeos/leafmap3,801 ★ · +29
| Repository | 2026-09-24 | 2026-11-14 |
|---|---|---|
| opengeos/leafmap | 3.8k | 3.8k |
29 Stars in the last 51 days, measured from the daily GitHub snapshot. Compare with other projects
Editorial analysis
The gap is defined by another package, not by a missing feature
The origin story is the shortest way to understand the scope. leafmap is described as a spin-off project of the geemap package, and geemap was designed specifically to work with Google Earth Engine. The stated reason leafmap exists is that not everyone in the geospatial community has access to that cloud computing platform. So the problem is an access problem, not a rendering one, and the design follows from it: the package targets a Jupyter environment such as Google Colab, Jupyter Notebook, JupyterLab or marimo, and it is positioned as usable by anyone who wants to analyse and visualise geospatial data interactively there. The description makes the audience split explicit, saying it is particularly accessible for novice users with limited programming skills while advanced programmers can use it for geospatial analysis and building interactive web applications.
The stack underneath is four projects with four jobs
The README names the layers it is built on and assigns each one a task. folium and ipyleaflet are listed for creating interactive maps. WhiteboxTools and whiteboxgui are listed for analysing geospatial data. ipywidgets is listed for designing the interactive graphical user interface. The requirements file is the concrete version of that list and shows what a default install actually pulls in: geopandas, folium, ipyleaflet, ipywidgets, plotly, bokeh's companion bqplot, maplibre, ipyvue, ipyvuetify, anywidget, xyzservices for basemap lookups, gdown for downloads, pystac-client for catalogue access, duckdb, numpy, pandas, matplotlib, geojson, python-box, whiteboxgui and scooby. Two of those carry a minimum version, ipyevents at 0.8.0 and ipyvue at 1.12.0, and duckdb is pinned to 1.4.1 or newer.
Ten optional dependency groups are the real interface
The packaging metadata declares dependencies as dynamic and puts them in optional groups instead, which is unusual and useful. The groups are backends, lidar, raster, viewer, usgs, sql, apps, vector, pmtiles, ai and maplibre. Each answers a different job: backends pulls bokeh, keplergl, maplibre, pydeck and plotly; lidar pulls laspy, pyntcloud with LAS extras, pyvista with all extras, panel, ipygany and ipyvtklink; apps pulls streamlit-folium, voila and solara, which are three different ways to turn a notebook into an application; vector pulls geopandas, osmnx, pmtiles, flask, flask-cors, lonboard and mapclassify; ai pulls rastervision, pytorch-lightning and torchgeo. So the default install is a mapping library and everything else is opt in, and a machine learning user does not inherit the geospatial GUI stack.
Five mapping backends sit behind one call
The first named feature is creating an interactive map with one line of code, and the second is switching between mapping backends. The list is ipyleaflet, folium, kepler.gl, pydeck and bokeh, which is a much wider spread than a mapping library usually offers, and it is spread across two rendering models: some produce a JavaScript map you embed in an output cell, others draw in the browser widget itself. The third feature follows from that: basemaps can be changed interactively, with OpenStreetMap, Stamen Terrain and CartoDB Positron named as examples and the phrase and many more closing the list. The consequence for a reader is that choosing leafmap partly means choosing which backend will carry the map, since the interactive tools described in the introduction work on top of whichever one is active.
Five hundred WhiteboxTools run from the interface, not from code
The analysis story is delegated rather than implemented. The README says users can use the analytical backend, naming WhiteboxTools, to perform geospatial analysis directly within the leafmap interface without writing a single line of code. The library behind that interface is described as currently containing more than 500 tools for advanced geospatial analysis, grouped into categories that include GIS Analysis, Geomorphometric Analysis, Hydrological Analysis and LiDAR Data Analysis. That count is the reason the package can claim a broad toolset without shipping its own algorithms, and it is also the reason the lidar extra exists, since several of those categories depend on point cloud libraries that are not part of a default install.
The complaint about other tools is one-directional communication
The Statement of Need is written as a critique of the existing ecosystem, and the critique has a specific technical content. There are many packages for geospatial analysis, geopandas named for vector data and xarray for raster data, and a plotting index lists many more options ranging from map focused libraries such as ipyleaflet and folium to general purpose tools that also accept geospatial types, with hvPlot, bokeh and plotly given by name. The specific gap claimed is that displaying data from different file formats on an interactive map and doing basic analysis is challenging, especially for users with limited coding skills, and that many tools lack bi-directional communication between the front end in the browser and the back end in Python, which limits interactivity. leafmap's answer is to use the bidirectional communication ipyleaflet provides, which is why that library is named first among the foundations.
The container is a Jupyter base image plus conda geospatial packages
The Dockerfile is a deployment recipe rather than a development one, and it starts from a published Jupyter notebook image. It switches to root, installs git, and then uses mamba to add packages into the base environment from conda-forge: boto3, gdal, proj, geos, fiona, rasterio, pyproj, flask, flask-cors, leafmap itself, jupyter-server-proxy, qgridnext, rioxarray, polars, obstore, voila and voila_topbar. Three environment variables are then set for the geospatial stack, PROJ_LIB and GDAL_DATA pointing into the conda share directories and LOCALTILESERVER_CLIENT_PREFIX set to a proxy template with a port placeholder. Two workarounds are worth noting: missing sqlite library names are created as symlinks, and the Jupyter server configuration is written on the fly to raise the websocket maximum message size to 100 megabytes, which is what lets large arrays travel from Python to the browser.
Version 0.63 with a Python 3.9 floor and classifiers to 3.13
The release cadence is frequent and the version is not typed in by hand. The manifest declares dependencies as dynamic and pins the build to setuptools with setuptools_scm, so the number comes from the repository history rather than from a field. The declared version is 0.63.1, matching the newest release tag v0.63.1 published on 2026-08-02, after v0.63.0 on 2026-07-04 and v0.62.0 on 2026-04-30. The last push to the default branch master is dated 2026-09-28 and the repository is not archived. Requires-python is 3.9 or newer while the classifiers stop at Python 3.13, and the classification claims a production stable status. Around the code sit the automation files one would expect: a pre-commit configuration, a mergify configuration, a citation file, a Dockerfile, split requirement files for development and documentation, and a paper directory holding the journal article referenced by the DOI badge.
Editorial conclusion
leafmap suits an analyst who wants an interactive map and a processing toolset inside Colab, JupyterLab or marimo without writing glue code, and it suits a teacher who needs a GUI rather than an API. It does not suit a pipeline that has to run headless with no notebook in the loop, since the package is designed around the notebook front end. Before installing, pick the extras you actually need rather than the whole list, check that your Python is 3.9 or newer with the classifiers reaching only 3.13, and read the version, which is derived by setuptools_scm rather than typed into the manifest.
Frequently asked questions
What is leafmap in Python?
A Python package for interactive mapping and geospatial analysis with minimal coding in a Jupyter environment, such as Google Colab, Jupyter Notebook, JupyterLab or marimo. It is a spin-off of geemap and is aimed at users who do not have access to Google Earth Engine.
How do I install leafmap?
The README links the PyPI page, the conda-forge package and the conda-forge feedstock rather than giving one command. The project container installs it with mamba from conda-forge, and the package supports Python 3.9 and newer with dependency groups such as backends, lidar and apps available as extras.
Is leafmap free to use?
Yes. The README lists it as free software under the MIT licence, and the packaging metadata declares the same licence along with a Development Status :: 5 - Production/Stable classifier. The documentation site, the tutorials and the package itself are all presented as freely available.
What is the difference between geemap and leafmap?
geemap was designed specifically to work with Google Earth Engine, while leafmap is the spin-off created for users who do not have access to that cloud platform. leafmap covers interactive mapping and geospatial analysis in a Jupyter environment using folium, ipyleaflet, WhiteboxTools and ipywidgets.
Official sources
Add this badge to your README
If you maintain this project, the badge below links readers to this analysis and shows its maintenance status from the daily GitHub snapshot. Paste the markdown into your README; add ?metric=license or ?metric=stars to the image URL for a different field.

[](https://hysenlabs.com/projects/opengeos-leafmap)Star history chart for your README
[](https://hysenlabs.com/projects/opengeos-leafmap)Was this useful?