great-tables: a setup.py that is not there, a type check aimed at gt, and a citation still on 0.14.0
Make awesome display tables using Python
At a glance
- What is it?
- A Python package that composes publication tables out of named parts, a header, a footer, a stub of row labels and spanner labels over the columns, then renders them from a Pandas or Polars frame to HTML or an image. Its Makefile targets a directory called gt and calls setup.py, neither of which matches the package layout, and the citation block in the README still names version 0.14.0 while 1.0.0 shipped in September.
- Who is it for?
- Reach for it when a table is the point of the output rather than an afterthought, and when you already live in a notebook or a Quarto document, since that is the environment the page assumes. Three checks before you rely on it.
- Can I use it commercially?
- Yes. MIT is a permissive licence: you can use, modify and sell software built on it, as long as you keep its copyright and licence notices.
- Is it still maintained?
- Yes. The repository received new commits within the last day.
- What is it written in?
- Mainly Python, according to GitHub's language statistics.
Answers come from the project's GitHub data, last synced on November 15, 2026, and from our analysis. They are not legal advice.
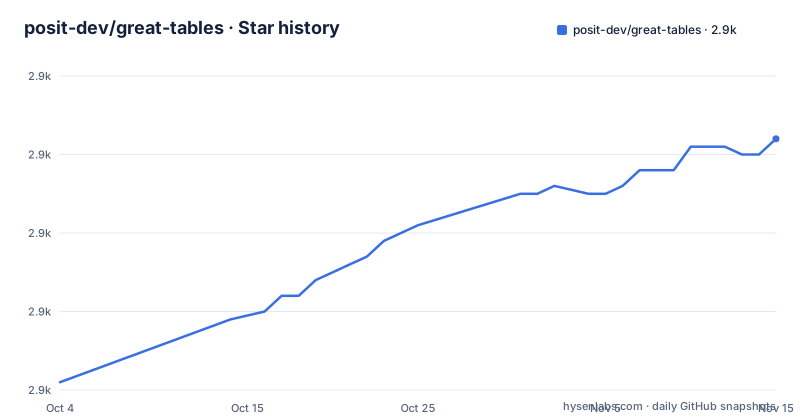
Star history
- posit-dev/great-tables2,922 ★ · +31
| Repository | 2026-10-04 | 2026-11-15 |
|---|---|---|
| posit-dev/great-tables | 2.9k | 2.9k |
31 Stars in the last 42 days, measured from the daily GitHub snapshot. Compare with other projects
Editorial analysis
A table is assembled from named parts, not written as a grid
The design idea is one sentence: a wide variety of useful tables can be built by working with a cohesive set of table components that you mix and match. The named parts are the header and the footer, a stub that holds row labels, and spanner labels arranged over the top of the column labels, which is how grouped headers are expressed. Cell values are then formatted through separate methods rather than being pre-formatted by hand, and the example in the README chains a header with a title and subtitle, a currency formatter across the open, high, low and close columns, and a date formatter on the date column. Everything returns the table object, so the whole construction is a fluent chain rather than a configuration object. The stated philosophy is deliberately modest: simple methods for everyday display tables, with the power available when it is needed.
Data in, HTML or an image out, and nothing prints to the console
The pipeline has three stages and the page is explicit about all of them. It starts with table data in the form of a Pandas or Polars DataFrame. You then decide how to compose the output with the elements and formatting the task needs. Finally the table is rendered, to HTML by default, or to an image file. That last step has a consequence worth knowing before you write code: tables do not print to the console. In a notebook or a Quarto document they render as part of the output, but at a plain console prompt the show() method opens the rendered HTML table in your default browser instead. So the same object behaves differently depending on where it is evaluated, which matters when you are chaining transformations in a script rather than working interactively.
The citation block still says 0.14.0 while 1.0.0 shipped in September
The README asks users to cite the package and provides a BibTeX entry, and that entry names version 0.14.0. The release history tells a different story: v0.23.0 on 2026-07-27, v0.24.0 on 2026-08-24 and v1.0.0 on 2026-09-25, published the day after the last commit on the default branch. So the one piece of metadata the project asks you to copy into a paper is several minor versions behind its own history, and the 1.0.0 tag marks a step that the citation does not reflect. There is a citation file at the repository root as well, which is the better place to look. The rest of the governance material is in order: the project is primarily maintained by Rich Iannone with other authors occasionally assisting, the licence is MIT with the copyright held by Posit Software, PBC, and a contributor code of conduct is linked.
make dist calls setup.py, and no setup.py is in the tree
The build configuration moved to a declarative layout and the Makefile did not follow. The pyproject file names setuptools with setuptools_scm as the build backend, declares the version as dynamic so it is derived from the repository state, includes the great_tables package and its subpackages, and points the licence at a file. There is no setup.py in the top-level listing. Yet the dist target runs python3 setup.py sdist and then python3 setup.py bdist_wheel, and the install target installs dist/gt*.whl. Both of those steps assume a script-based build and a wheel named with a gt prefix, while the package name is great-tables and the import package is great_tables. The clean targets, by contrast, are conventional and still make sense, removing build directories, egg metadata, compiled Python files and test caches.
make check type-checks a directory called gt for Python 3.8 and 3.9
The check target runs the type checker four times in a row, once for each interpreter version 3.8, 3.9, 3.10 and 3.11, and every invocation points at a path called gt. Two things are off about that. The path does not match the layout, where the source lives in a great_tables directory, and the name is a leftover from the R package of the same idea rather than the Python import path. The version list is off in the other direction: the package declares requires-python of 3.10 or newer and lists classifiers for 3.10 through 3.14 plus PyPy, so type checking against 3.8 and 3.9 spends effort on interpreters the project no longer claims to support. The other test targets are more current: coverage measured over the great_tables package, a separate invocation of the dependency tests marked no_pandas, and a snapshot update mode for the snapshot test suite.
Eight runtime dependencies, and pandas is not one of them
The dependency list is short and mostly small: a Markdown processing library, an icon set package, an HTML tooling library, a table composition package, importlib metadata and resources for older interpreters, typing extensions, and Babel for locale-aware formatting, which is what date and currency formatting leans on. Neither Pandas nor Polars appears, and that is deliberate rather than accidental: there is a dedicated test target that runs the dependency tests marked no_pandas, so the package is exercised in a configuration without it, and the page presents Pandas and Polars as two interchangeable inputs. The package also ships JavaScript and CSS as package data, which is how a package that renders HTML still carries styling and behaviour with it.
The documentation site is a Quarto project checked into the repository
The top level reads like a website rather than a library. There is an index document, a documentation configuration file beside a directory of the same name, a user guide directory, a blog directory, an assets directory and a frozen output directory, alongside the more conventional docs/, examples/, scripts/, tests/ and a type checker configuration. The examples directory holds its own data folder and two worked examples, one of them built around an extras package and another around sports earnings. Documentation building is a two-step recipe in the Makefile, an API reference generated with quartodoc and then a full render with Quarto, both run from inside the docs directory. Pre-commit is run through uvx rather than a local install, in one target to install the hooks and another to run them across all files.
Sixteen datasets ship inside the package
The package carries its own data, sixteen datasets in total: countrypops, sza, gtcars, sp500, pizzaplace, exibble, towny, peeps, films, metro, gibraltar, constants, illness, reactions, photolysis and nuclides. The page is candid about why they are there, describing all of it as material for experimenting with the functionality, and says the documentation leans on them extensively. Two of them are familiar from other contexts, since one is a stock index table used in the README example and another is a pizza sales table, which makes them convenient for trying formatting methods without loading anything. Installation is offered two ways, from PyPI or from Conda-Forge, and the two commands use the underscored import name rather than the hyphenated distribution name:
conda install conda-forge::great_tablesEditorial conclusion
Reach for it when a table is the point of the output rather than an afterthought, and when you already live in a notebook or a Quarto document, since that is the environment the page assumes. Three checks before you rely on it. The declared floor is Python 3.10, so ignore the Makefile's type checks for 3.8 and 3.9. The build targets in that Makefile refer to a gt directory and to setup.py, neither of which matches the current layout, so use the packaging tools rather than those targets. And if you cite the package, do not copy the README entry, which still says version 0.14.0 while the current release is 1.0.0; the repository does carry a citation file at the root. Pandas is optional, so a Polars-only project will not be forced to install it.
Frequently asked questions
How do I install great_tables?
From PyPI with pip install great_tables, or from Conda-Forge with conda install conda-forge::great_tables. The package requires Python 3.10 or newer and its classifiers cover 3.10 through 3.14 as well as PyPy.
What does a great_tables table take as input?
A Pandas or Polars DataFrame. The table is then rendered to HTML, which is the default, or to an image file. Tables do not print to the console, so at a plain prompt the show() method opens the rendered HTML in your default browser instead.
What parts can a great-tables table be built from?
A header and a footer, a stub that contains the row labels, spanner labels arranged over the column labels, and formatting methods applied to cell values. The construction is a chain of methods on the table object rather than a configuration object.
Which datasets are included with great-tables?
Sixteen: countrypops, sza, gtcars, sp500, pizzaplace, exibble, towny, peeps, films, metro, gibraltar, constants, illness, reactions, photolysis and nuclides. The documentation uses them extensively as material for experimenting with formatting.
Who maintains great-tables, and under what licence?
Rich Iannone primarily maintains the project, with other authors occasionally assisting, and the copyright is held by Posit Software, PBC. The licence is MIT, and the project is released with a contributor code of conduct.
Where do I report a bug in great-tables?
On the project's GitHub issue tracker. The page also points at GitHub Discussions for questions and answers, a Discord server for development discussion and table sharing, and an X account that posts previews of in-development features.
Official sources
Add this badge to your README
If you maintain this project, the badge below links readers to this analysis and shows its maintenance status from the daily GitHub snapshot. Paste the markdown into your README; add ?metric=license or ?metric=stars to the image URL for a different field.

[](https://hysenlabs.com/projects/posit-dev-great-tables)Star history chart for your README
[](https://hysenlabs.com/projects/posit-dev-great-tables)Was this useful?