nyc-taxi-data: two loaders for a Parquet-only TLC dataset
Import public NYC taxi and for-hire vehicle (Uber, Lyft) trip data into a PostgreSQL or ClickHouse database
At a glance
- What is it?
- This repository is a set of shell scripts that pull 3+ billion NYC taxi and ride-hailing trips into PostgreSQL or ClickHouse, and since the TLC's May 2022 Parquet switch one of those two paths still routes every file through CSV. Useful when you want the raw public records under your own schema, useless if you would rather read Parquet yourself.
- Who is it for?
- Adopt this repository when you want the TLC's Parquet trip files inside a database you control, with the author's schema, geography tables and bundled shapefiles already wired together. Skip it when you already run a working Parquet pipeline, because nothing here adapts past the fixed shell importers and the PostgreSQL route still converts every file to CSV first.
- Can I use it commercially?
- Yes. MIT is a permissive licence: you can use, modify and sell software built on it, as long as you keep its copyright and licence notices.
- Is it still maintained?
- Yes. The repository last received commits 43 days ago.
- What is it written in?
- Mainly R, according to GitHub's language statistics.
Answers come from the project's GitHub data, last synced on November 7, 2026, and from our analysis. They are not legal advice.
Star history
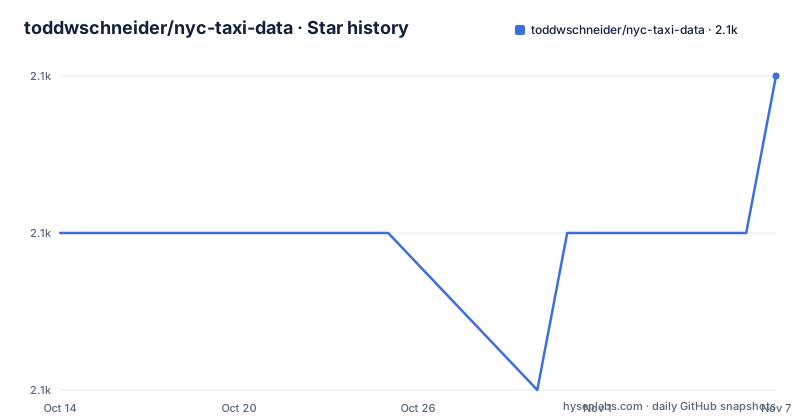
- toddwschneider/nyc-taxi-data2,085 ★ · +1
| Repository | 2026-10-14 | 2026-11-07 |
|---|---|---|
| toddwschneider/nyc-taxi-data | 2.1k | 2.1k |
1 Stars in the last 24 days, measured from the daily GitHub snapshot. Compare with other projects
Editorial analysis
Three billion trips and the Parquet switch that made R mandatory
The project is a pile of scripts rather than a library. Nothing at the repository root installs as a package: the entries are shell files, a `clickhouse/` directory, a `data/` directory, and folders of analysis code. Most raw input comes from the NYC Taxi & Limousine Commission, and the scope is 3+ billion taxi and for-hire vehicle trips originating in the city since 2009, covering yellow and green cabs plus Uber, Lyft, Via and Juno. An engineer with a database server and a preference for owning the schema is the intended reader. Someone shopping for a hosted trips API or a turnkey dashboard is not.
The May 2022 switch from CSV to Parquet reshaped everything else here, and it was not incremental. The TLC replaced all historical files as well as the new ones, so a pipeline built against the old download paths stops resolving outright. The README states that the repository no longer works with the CSV files the TLC used to publish, and it points at a pinned older commit for anyone still holding those files.
One number deserves a second look. The post this repository was built for is titled around 1.1 billion trips, while the same README counts 3+ billion since 2009. Analysis code carried over from that post was written against a far smaller table, and a query with no lower date bound will now scan rows nobody had when it was tuned.
PostgreSQL still loads through CSV because of the COPY command
Both database targets read the same Parquet downloads, and the two routes are not equivalent. The PostgreSQL route keeps the original shape of the project: each Parquet file is converted into a CSV first, and that CSV is what feeds the Postgres `COPY` command. This intermediate step is why R stopped being optional. The stated reason for the choice is speed, that the `arrow` package in R beat some of the command line converters tried, so R became the mandatory bridge between Parquet and `COPY` even though other Parquet to CSV paths exist.
The price is that each file passes through two representations instead of one, and the conversion sits inside every importer rather than behind a switch. Making R mandatory also lengthens the requirement list: PostgreSQL, PostGIS and now an R installation with a working Parquet reader, all on a machine that also holds every downloaded file. There is a second oddity in that stack. The repository's primary language is listed as R, yet every documented entry point is a shell script, so R shows up as a conversion step inside a shell pipeline rather than as an analysis surface.
ClickHouse reads Parquet directly and never meets R
A second set of scripts lives in the `clickhouse/` directory and loads the Parquet files straight into ClickHouse. The difference in approach is concrete rather than cosmetic: no per-file CSV conversion sits in that path, so nothing in the documented ClickHouse route asks you to install R, and the columnar files stay columnar from download to query.
That choice suits a specific workload. Scanning billions of rows in columns is what the engine consumes natively, so the rewrite the PostgreSQL path still performs disappears. Joining taxi zones against census tracts is the opposite case. The PostgreSQL schema is written down column by column, with PostGIS handling the spatial side, while the `clickhouse/` directory gets a single README link and no equivalent breakdown. The named geography tables have no documented ClickHouse counterpart, so the geography layer is not something the README promises you on that side. That asymmetry is the honest reason to read the two directories before choosing.
Five setup steps, four import scripts, and a day of waiting
The documented order of operations for the PostgreSQL route starts with software: PostgreSQL and PostGIS first, both available through Homebrew on Mac, then R from CRAN. From there, two commands run from the repository root:
./download_raw_data.sh
./initialize_database.sh
The first fetches the raw files, the second creates the database and applies the schema. Trip data then loads through four separate scripts, one per trip family:
./import_yellow_taxi_trip_data.sh
./import_green_taxi_trip_data.sh
./import_fhv_taxi_trip_data.sh
./import_fhvhv_trip_data.sh
Run the ones that match what you actually downloaded. A full import can take several hours or possibly over a day depending on computing power, so schedule it rather than watch it.
Aggregate figures from the TLC's summary statistics reports come from a Ruby script in the `tlc_statistics/` folder:
ruby import_statistics_data.rbThose numbers feed the author's NYC Taxi & Ridehailing Stats dashboard, which is a separate piece of work from the loaders here.
Six tables, and two of them carry geography
The schema is the part worth reading closely. `trips` holds every yellow and green taxi trip, with a `cab_type_id` that references `cab_types` and resolves to `yellow` or `green`. `fhv_trips` holds for-hire vehicle records, which covers Uber, Lyft, Via and Juno, and `fhv_bases` maps those records to base names and doing business as labels, which is where the app names live. `nyct2010` carries NYC census tracts plus the Newark Airport and maps tracts to neighborhood tabulation areas. `taxi_zones` holds the TLC's official taxi zone boundaries, and `central_park_weather_observations` carries summary weather data by date.
That layout has a practical edge. Merging yellow and green cabs into one table and pushing the vehicle class into `cab_types` means a question about all cab trips touches a single table. Separating ride-hailing into its own table means a query over cab trips never has to reconcile medallion rows with for-hire rows. The ride-hailing join costs an extra lookup against `fhv_bases` and buys readable operator names in place of bare base numbers, which is a fair trade when your output is a report rather than a dashboard refresh.
Coordinates vanish in July 2016 and fares arrive in February 2019
Two data gaps will shape any time series you build. Starting in July 2016 the TLC stopped publishing pickup and dropoff coordinates, and each trip carries taxi zone IDs for pickup and dropoff instead, which is why `taxi_zones` is part of the schema rather than an optional extra. Rows from before that month do not carry zone IDs either, so a cross-year comparison of geography has to stop at a named boundary rather than at a code change.
The second gap is narrower. The May 2022 update added passenger fares, driver pay and time spent waiting for passengers to the high volume for-hire vehicle files, and those fields exist only back to February 2019. Driver earnings before that month cannot be reconstructed from these files, no matter how long the import runs or how much disk you attach. For an economics question on pre-2019 ride-hailing data, this repository is the wrong tool and the TLC's own published aggregates are the place to start.
The setup steps name scripts that differ from the root listing
Setting the root listing against the five documented steps turns up a gap. The top level carries `create_indexes.sh`, `download_raw_2014_uber_data.sh` and `import_2014_uber_trip_data.sh`, and no setup step mentions any of them. The name `create_indexes.sh` says what it does, yet nothing states when to run it or whether `./initialize_database.sh` already covers the same ground. On tables this size that question deserves an answer before a multi-hour import, not after.
The for-hire importer is the sharper example. Step 5 of the documented setup tells you to run `./import_fhv_taxi_trip_data.sh`, while the root listing of repository files names `import_fhv_trip_data.sh`, with the taxi segment dropped. Copy the documented string and no file of that name exists in the listing, while the file you need sits under a slightly different name. The 2014 pair shows the same pattern, scripts that exist at the root with no instructions attached.
Two smaller inconsistencies sit nearby. Both internal links into the repository address `master`, while the default branch is `main`, so a link copied straight out of the README points at a branch that is no longer the default one. The link to the pre-Parquet code is built differently: it is pinned to commit `2e805ab0f1bf362f890c6b6f227526c575f73b67`, which keeps resolving whatever the branch gets renamed.
Bundled shapefiles and a Ruby script for TLC aggregates
Several inputs ship inside the repository, so they need no separate download: the shapefile for NYC census tracts and neighborhood tabulation areas from Bytes of the Big Apple, the taxi zone shapefile from the TLC, the mapping of FHV base numbers to names from the TLC's aggregate report, and Central Park weather data from the National Climatic Data Center. Daily weather in `central_park_weather_observations` is the cheapest join on offer for a demand question involving rain or temperature.
Alongside the loaders sit analysis folders written for published posts, `citibike_comparison/` and `analysis/2017_update/`, and the README points at Mark Litwintschik's benchmark page as a place where this dataset has been used to compare technology stacks, PostgreSQL and ClickHouse among them. That is the closest thing here to an outside performance reference, and it was produced by somebody other than this repository.
Two housekeeping facts close the picture. Licensing is short: an MIT `LICENSE` file sits in the root listing beside the scripts, so a pipeline built on them carries a permissive notice rather than a copyleft clause. On upkeep, the last push was on 2026-09-25 and the repository publishes no GitHub releases, so pinning what you depend on means pinning a commit.
Editorial conclusion
Adopt this repository when you want the TLC's Parquet trip files inside a database you control, with the author's schema, geography tables and bundled shapefiles already wired together. Skip it when you already run a working Parquet pipeline, because nothing here adapts past the fixed shell importers and the PostgreSQL route still converts every file to CSV first. Check disk space for the raw downloads and your machine's patience for an import the README puts at several hours to over a day, and read the root listing before you trust the step 5 command name.
Frequently asked questions
Does nyc-taxi-data still need R to load the TLC Parquet files into PostgreSQL?
Yes for the PostgreSQL route. R used to be optional, but the May 2022 file format change made it required, because each Parquet file is converted to CSV before `COPY` runs. The README states that R's `arrow` package was faster than some of the command line converters tried, which is why R sits in the middle of that path.
Can nyc-taxi-data import the old TLC CSV files?
No. The current code no longer works with those CSV files, which the TLC no longer hosts for download. The README points to the pinned pre-Parquet commit `2e805ab0f1bf362f890c6b6f227526c575f73b67` for anyone who still has them.
Which tables does nyc-taxi-data create, and what goes in them?
`trips` holds yellow and green taxi records with a `cab_type_id` pointing at `cab_types`, `fhv_trips` holds for-hire vehicle records including Uber, Lyft, Via and Juno, and `fhv_bases` maps those to base names and doing business as labels. `nyct2010`, `taxi_zones` and `central_park_weather_observations` add census tracts, taxi zone boundaries and daily weather.
Do nyc-taxi-data trips have pickup and dropoff coordinates?
Not after July 2016. From that month on, the TLC publishes taxi zone IDs for pickup and dropoff instead of coordinates, which is why the `taxi_zones` boundary table is part of the schema rather than an optional extra.
How long does a full nyc-taxi-data import take?
The README warns that the full import process might take several hours or possibly over a day, depending on computing power. Load only the trip families you downloaded, since each has its own script.
Official sources
Add this badge to your README
If you maintain this project, the badge below links readers to this analysis and shows its maintenance status from the daily GitHub snapshot. Paste the markdown into your README; add ?metric=license or ?metric=stars to the image URL for a different field.

[](https://hysenlabs.com/projects/toddwschneider-nyc-taxi-data)Star history chart for your README
[](https://hysenlabs.com/projects/toddwschneider-nyc-taxi-data)Was this useful?