Gatus turns one YAML file into a health dashboard and alert router
Automated developer-oriented status page with alerting and incident support.
At a glance
- What is it?
- How Gatus schedules HTTP, ICMP, TCP and DNS probes, judges them against a list of conditions, and routes failures to dozens of providers, plus the points where a green dashboard stops telling you anything useful.
- Who is it for?
- Gatus fits teams that want a self-hosted dashboard with alert routing and Prometheus metrics in a single Go binary, and it is a poor fit for anyone who needs proof that a user-facing workflow works or wants stability guarantees on suites, remote instances or the old Teams integration.
- Can I use it commercially?
- Yes. Apache-2.0 is a permissive licence: you can use, modify and sell software built on it, as long as you keep its copyright and licence notices.
- Is it still maintained?
- Yes. The repository last received commits 3 days ago.
- What is it written in?
- Mainly Go, according to GitHub's language statistics.
Answers come from the project's GitHub data, last synced on November 14, 2026, and from our analysis. They are not legal advice.
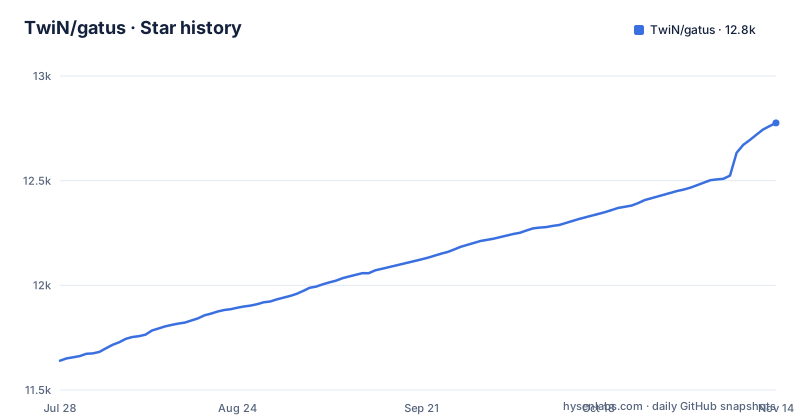
Star history
- TwiN/gatus12,776 ★ · +1,136
| Repository | 2026-07-28 | 2026-11-14 |
|---|---|---|
| TwiN/gatus | 11.6k | 12.8k |
1,136 Stars in the last 109 days, measured from the daily GitHub snapshot. Compare with other projects
Editorial analysis
The protocol you pick decides what a green row actually proves
Gatus monitors services with HTTP, ICMP, TCP and DNS queries, and its FAQ adds endpoints for UDP, SCTP, WebSocket, gRPC, SSH, STARTTLS and TLS, plus a domain expiration check that sits on top of the linked-in registrobr/rdap v1.1.8 and TwiN/whois v1.3.0 packages. Each protocol answers a different and much smaller question. An ICMP probe proves a host replied to a packet. An HTTP query proves a status code came back. A DNS query proves a resolver answered. None of them prove the application behind the port is doing its job, so a board full of green HTTP codes says nothing about a request that fails three steps later in the flow. If the real failure lives in application logic, the only handle you have is a condition on the response body, and the check is only ever as good as that condition.
Conditions are an explicit list, so anything you never referenced can never fail
Results are judged by a list of conditions applied to values such as the status code, the response time, the certificate expiration and the body, with placeholders and functions for building the expressions. The repository tree has matching directories such as config/, jsonpath/, storage/, alerting/ and watchdog/. The consequence of an enumerated model is simple. A check is exactly as strict as the conditions you wrote, and a field you never referenced can be empty, truncated or wrong without turning the indicator red. Storage is a separate decision, and both modernc.org/sqlite v1.59.0 and lib/pq v1.12.3 are compiled into the same binary, so a Postgres deployment does not require a different build even though the choice of backend constrains everything you keep afterwards.
The runtime image is a scratch container, so there is no shell to debug in
The Dockerfile builds with golang:alpine and then copies a single static binary into a FROM scratch layer, alongside the certificate bundle and config/config.yaml. Because the build sets CGO_ENABLED=0, SQLite works through the pure-Go modernc.org driver rather than cgo, and the shipped image has no shell, no package manager and no coreutils. When a check behaves oddly inside a container, you cannot exec in and poke around; the options are reproducing the config on a machine you control or mounting a shell-bearing image with the same binary. The environment surface is small and fixed, which is the one thing that makes this image easy to reason about:
docker run -p 8080:8080 --name gatus ghcr.io/twin/gatus:stableThe same image is mirrored on Docker Hub under a different name, so a compose file that pins one registry will not work against the other:
docker run -p 8080:8080 --name gatus twinproduction/gatus:stableThe defaults baked in are GATUS_CONFIG_PATH set to an empty string, GATUS_LOG_LEVEL at INFO, PORT at 8080, and /gatus as the entrypoint, which means the config.yaml copied into the image is what runs until you point that variable somewhere else.
go mod tidy -diff turns an untidy go.mod into a failed image build
One line in the builder stage stops a build before anything compiles. The stage runs go mod tidy -diff, which exits non-zero when go.mod or go.sum is out of sync with the imports, and the failure happens on the source tree as copied rather than against a canonical module cache. Forks, vendored mirrors and automated rebuild bots inherit this behavior, so a change that looks harmless locally can break the image. The compile step itself is a static cross build:
CGO_ENABLED=0 GOOS=linux go build -a -installsuffix cgo -o gatus .Running from a checkout requires Go 1.26.3, the version pinned in go.mod, which is a recent toolchain and the constraint most likely to be missed when someone pins a CI base image. The Makefile spells out the local workflow, with install for the binary, run setting ENVIRONMENT=dev alongside GATUS_CONFIG_PATH=./config.yaml, run-binary, clean, and test for go test ./... -cover. The front end under web/ has its own npm targets, so a change to the dashboard code needs Node as well as Go.
Suites are alpha and remote instances are experimental, inside the same file as your credentials
Two configuration surfaces carry explicit maturity labels. Suites is marked ALPHA, and remote instances are marked EXPERIMENTAL. Neither label is a stability guarantee, and both live in the same config file that holds your alerting keys, endpoint definitions and OAuth credentials.. Teams alerting shows the same pattern with an older label: the reference still carries a deprecated Teams integration and a separate Teams Workflow integration beside it. If your webhook predates that split, confirm which one it now feeds before you read silence as health.
A 431 FAQ entry means something in front of Gatus is inflating request headers
Among the FAQ entries are a question about a 431 Request Header Fields Too Large error, one on proxy client configuration, and separate entries for exposing Gatus on a custom path and a custom port. A 431 is a web server refusing request headers it considers too large, and the README gives it its own FAQ entry. Path and port are config keys in the same file, and environment variables can fill config values, so anything you hardcode in a proxy, an ingress, or a bookmark has to be kept in step by hand.
Security, maintenance windows and metrics are three independent switches you must turn yourself
Three areas of the config change what the dashboard reveals. Security offers Basic Authentication and OIDC, with github.com/coreos/go-oidc/v3 v3.21.0 and golang.org/x/oauth2 v0.36.0 linked in to serve it, and neither appears in the quick start command, so a Gatus you publish without writing those keys shows its endpoint list and stored results to anyone who loads the page. Gatus cannot protect a dashboard you exposed on purpose; authentication is opt-in, and a single missed key is the whole boundary. Maintenance windows are a second switch, letting planned work mute alerts instead of paging someone at three in the morning. Metrics are a third, feeding Prometheus through prometheus/client_golang v1.23.2 with a separate custom labels option, which makes label values the axis your dashboards group by, and a label derived from something volatile will generate a new time series on every change.
Three releases in seven months on a module path that carries its major version
v5.36.0 shipped 2026-05-19, v5.37.0 on 2026-09-24 and v5.38.0 on 2026-10-28, with the most recent push to the master branch on 2026-10-29. Pinning is worth the trouble: a container tracking the :stable tag is not the binary you validated last week. The module is github.com/TwiN/gatus/v5, so any Go code importing these packages has to carry the /v5 suffix, and the license is Apache-2.0. Alerting is the widest surface in the configuration, spanning close to forty providers from Slack, PagerDuty, Discord, Teams and Telegram to Signal, Twilio, Pushover, Gotify, n8n, custom webhook endpoints, and a default alert that applies when an endpoint names none of its own. Announcements, the web and UI keys, client configuration and tunneling sit alongside those, and a managed solution is linked from the README at gatus.io.
Editorial conclusion
Gatus fits teams that want a self-hosted dashboard with alert routing and Prometheus metrics in a single Go binary, and it is a poor fit for anyone who needs proof that a user-facing workflow works or wants stability guarantees on suites, remote instances or the old Teams integration. Before committing, check three things: which config keys belong to the alpha and experimental surfaces, which Teams integration your webhook now needs, and which Go version your build image has, since go.mod pins 1.26.3 and the image build fails on an untidy go.mod.
Frequently asked questions
how to install gatus
The quick start is a single container run, either from the GitHub registry or from Docker Hub under the twinproduction name, both mapping port 8080. To build from source you need Go 1.26.3 as pinned in go.mod, and the Makefile install target produces the binary.
how to use gatus
Endpoints, conditions, alerting providers, storage and security are all declared in the config file, and GATUS_CONFIG_PATH selects which file is read while GATUS_LOG_LEVEL controls logging. The Makefile run target sets ENVIRONMENT=dev and points GATUS_CONFIG_PATH at ./config.yaml for local work.
is gatus open source
Yes. The repository TwiN/gatus is released under the Apache-2.0 license and is written in Go, with prebuilt images published on GitHub Container Registry and Docker Hub. The README also points to a managed solution at gatus.io.
gatus vs kuma
Gatus runs HTTP, ICMP, TCP and DNS checks, evaluates conditions on values such as status code, response time, certificate expiration and body, and routes failures to Slack, Teams, PagerDuty, Discord, Twilio and many more. Check the other project before assuming the two are interchangeable.
gatus vs prometheus
Gatus is not a metrics system, it is a dashboard that can export to one. prometheus/client_golang v1.23.2 is compiled in and the config exposes a metrics section with custom labels, so Gatus can feed Prometheus rather than replace it.
Official sources
Add this badge to your README
If you maintain this project, the badge below links readers to this analysis and shows its maintenance status from the daily GitHub snapshot. Paste the markdown into your README; add ?metric=license or ?metric=stars to the image URL for a different field.

[](https://hysenlabs.com/projects/twin-gatus)Star history chart for your README
[](https://hysenlabs.com/projects/twin-gatus)Was this useful?