Uptrace: one APM UI, two databases, and a 2.1 release candidate
Open source APM: OpenTelemetry traces, metrics, and logs
At a glance
- What is it?
- Uptrace puts OpenTelemetry traces, metrics, and logs in ClickHouse while PostgreSQL holds metric names and alert metadata, and it ships under AGPL-3.0 with only pre-release (beta and release candidate) tags on the 2.1 line. Here is what the storage split, the local stack, and the build path actually commit you to.
- Who is it for?
- Uptrace fits teams that want traces, metrics, and logs in one ClickHouse backed UI and can run two databases plus a collector. Pin an exact pre-release tag, settle AGPL-3.0 exposure, and decide ClickHouse retention yourself before production traffic arrives.
- Can I use it commercially?
- Yes, with strict conditions. AGPL-3.0 is a network copyleft licence: if people use a modified version over a network, for example as a hosted service, you must offer them its source code under the same licence.
- Is it still maintained?
- Yes. The repository last received commits 1 day ago.
- What is it written in?
- Mainly Go, according to GitHub's language statistics.
Answers come from the project's GitHub data, last synced on November 15, 2026, and from our analysis. They are not legal advice.
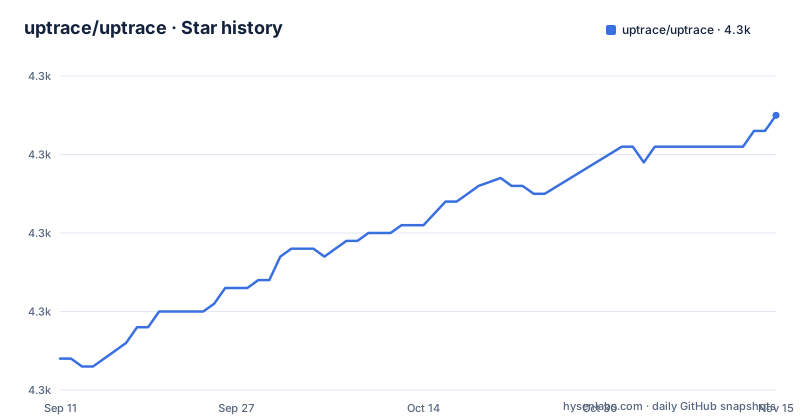
Star history
- uptrace/uptrace4,315 ★ · +31
| Repository | 2026-09-11 | 2026-11-15 |
|---|---|---|
| uptrace/uptrace | 4.3k | 4.3k |
31 Stars in the last 65 days, measured from the daily GitHub snapshot. Compare with other projects
Editorial analysis
ClickHouse stores the telemetry, PostgreSQL stores the names
Uptrace collects through the OpenTelemetry framework and keeps spans, metrics, and logs in ClickHouse, but it also needs PostgreSQL for metadata such as metric names and alerts. A working instance is therefore two stateful systems, not one. The shipped compose file provisions ClickHouse with a database, user, and password all named uptrace, a shard1, replica1, KEEPER_ID 1 triple, and a healthcheck that pings localhost:8123/ping once a second for 30 retries, then Postgres 15 alpine with PGDATA at /var/lib/postgresql/data/pgdata. Published ports are 8123, 9000, and 9440 for ClickHouse and 5432 for Postgres. Read that split as an operational fact: if Postgres goes away, spans and metrics stay in ClickHouse while the metric names and alert definitions the UI needs in order to render them are gone.
  clickhouse:
    image: clickhouse/clickhouse-server:25.3.3
    environment:
      CLICKHOUSE_DB: uptrace
      CLICKHOUSE_USER: uptrace
      CLICKHOUSE_PASSWORD: uptrace
      SHARD: shard1
      REPLICA: replica1
      KEEPER_ID: 1
    healthcheck:
      test: ['CMD', 'wget', '--spider', '-q', 'localhost:8123/ping']
      interval: 1s
      timeout: 1s
      retries: 30
    volumes:
      - ch_data5:/var/lib/clickhouse
      - ./config/clickhouse/config.xml:/etc/clickhouse-server/config.d/config.xml
      #- ./config/clickhouse/users.xml:/etc/clickhouse-server/users.d/users.xml
    ports:
      - '8123:8123'
      - '9000:9000'
      - '9440:9440'

  postgres:
    image: postgres:15-alpine
    environment:
      PGDATA: /var/lib/postgresql/data/pgdata
      POSTGRES_USER: uptrace
      POSTGRES_PASSWORD: uptrace
    volumes:
      - 'pg_data:/var/lib/postgresql/data/pgdata'
    ports:
      - '5432:5432'
The same compose file starts a collector, AlertManager, and Vector
Three more containers sit beside the two databases. The collector is pinned to otel/opentelemetry-collector-contrib:0.88.0, reads ./config/otel-collector.yaml, and publishes the OTLP ports 4317 and 4318. AlertManager runs prom/alertmanager:v0.24.0 with two explicit flags on port 9093, and it is the piece behind the AlertManager delivery option that sits alongside Email, Slack, and WebHook notifications. Vector runs timberio/vector:0.28.X-alpine with its config mounted read only. Named ingestion paths also cover Prometheus, FluentBit, and CloudWatch.
  otelcol:
    image: otel/opentelemetry-collector-contrib:0.88.0
    volumes:
      - ./config/otel-collector.yaml:/etc/otelcol-contrib/config.yaml
    ports:
      - '4317:4317'
      - '4318:4318'

  alertmanager:
    image: prom/alertmanager:v0.24.0
    ports:
      - 9093:9093
    command:
      - '--config.file=/etc/alertmanager/config.yml'
      - '--storage.path=/alertmanager'

  vector:
    image: timberio/vector:0.28.X-alpine
    volumes:
      - ./config/vector.toml:/etc/vector/vector.toml:ro
Building the server drags in a Vue toolchain
The Makefile offers no plain go build shortcut. The uptrace target cross compiles ./cmd/uptrace with CGO disabled, trimpath enabled, and a version string injected into github.com/uptrace/uptrace/pkg/internal/version, which the Makefile derives from the nearest v-prefixed git tag. An untagged checkout therefore produces a binary whose Version field is a commit hash instead of a release number, and that value is what shows up in version reporting. The front end is a separate target, uptrace-vue, which installs packages under vue/ with pnpm and then runs vue-cli-service in production mode; vue/ is a top level repository entry, so the UI is compiled from source rather than dropped in as a prebuilt bundle.
uptrace:
	CGO_ENABLED=0 go build -trimpath -o ./bin/uptrace_$(GOOS)_$(GOARCH)$(EXTENSION) \
		$(BUILD_INFO) -tags $(GO_BUILD_TAGS) ./cmd/uptrace

uptrace-vue:
	pnpm --dir=vue install
	(cd vue && pnpm vue-cli-service build --mode=production)

uptrace-all-sys: uptrace-darwin_amd64 uptrace-darwin_arm64 uptrace-linux_amd64 uptrace-linux_arm64 uptrace-windows_amd64

docker-uptrace:
	docker buildx build --file cmd/uptrace/Dockerfile \
	  --push --platform linux/arm64,linux/amd64 \
	  --tag uptrace/$(DOCKER_IMAGE):$(DOCKER_TAG) \
	  --tag uptrace/$(DOCKER_IMAGE):latest .
go.mod redirects ten dependencies into directories under pkg/
The module is github.com/uptrace/uptrace and it asks for go 1.24.0. Eleven replace directives pull work into this tree. Grafana Tempo becomes ./pkg/tempo, uptrace/pkg/clickhouse becomes ./pkg/clickhouse, and unsafeconv, tagparser, msgp, unixtime, idgen, and urlstruct each resolve to their own directory under pkg/. Three more cover the taskq queue family, including ./pkg/taskq/pgq and ./pkg/taskq/extra/oteltaskq, and segmentio/encoding is redirected to a fork, vmihailenco/encoding v0.3.4-0.20241127110735-a56c3dcf50f3. Plan for source builds that carry local forks rather than a clean upstream graph.
replace github.com/grafana/tempo => ./pkg/tempo

replace github.com/uptrace/pkg/clickhouse => ./pkg/clickhouse

replace github.com/uptrace/pkg/tagparser => ./pkg/tagparser

replace github.com/vmihailenco/taskq/v4 => ./pkg/taskq
Grafana reads Uptrace as a Tempo or Prometheus datasource
Uptrace is not only a page you open. Grafana can be configured to treat it as a Tempo or Prometheus datasource, which puts the SQL-like span aggregation language and the Promql-like metric language behind an external query surface. Both are Uptrace's own approximations rather than the upstream languages, so an expression copied from another tool needs checking against the project's query docs before you assume it parses. Two more behaviours matter on first use: 50 or more pre-built dashboards are created automatically once metrics start arriving, and the documented throughput figures, more than 10K spans per second on a single core and billions of spans and metrics on a single server, are the project's own numbers rather than anything measured here.
Users, projects, and SSO are wired through configuration files
User and project management runs through YAML config rather than a flow described in the docs, and single sign-on is OpenID Connect only, with Keycloak, Google Cloud, and Cloudflare named as providers. The require block backs that up: coreos/go-oidc/v3 v3.14.1 and golang-jwt/jwt/v4 v4.5.2 are the identity dependencies, and bun, bunrouter, and bunotel appear alongside them for the database and router layers. Budget for editing a config file and restarting the server when a teammate needs access, and prove the provider works before handing out dashboard links, because a wrong redirect setting can lock a whole team out of an otherwise healthy install.
Retention, upgrades, and rollback are left out of the docs
The README does not document data retention, a TTL for ClickHouse tables, an upgrade procedure, or a rollback for a schema change. Storage is the resource this design leans on hardest, so a self hosted APM with no documented retention knob pushes table management onto whoever operates ClickHouse by hand. The compose file does pin every moving part, clickhouse/clickhouse-server:25.3.3, postgres:15-alpine, otel/opentelemetry-collector-contrib:0.88.0, prom/alertmanager:v0.24.0, and timberio/vector:0.28.X-alpine, and it keeps ClickHouse data in a named volume, ch_data5, with config mounted from ./config/clickhouse/config.xml. One line is deliberately switched off: the users.xml mount is commented out, so per user ClickHouse settings do not apply until you uncomment it. Decide retention before importing production traffic.
The 2.1 line ships only beta tags under AGPL-3.0
Newest published releases are v2.1.0-rc.2 dated 2026-10-22, v2.1.0-rc.1 dated 2026-10-07, and v2.1.0-beta.8 dated 2026-08-13, and the last push to the default branch master is 2026-10-22. No stable 2.1.0 tag appears among them, which means a production install is a pre-release build and should be pinned to the exact pre-release tag you exercised rather than to a moving tag. The license is AGPL-3.0, and that is the second thing to settle before exposure: if the instance becomes reachable by people outside your organisation, read what the license asks of a network service instead of assuming permissive terms. CHANGELOG.md and CONTRIBUTING.md are both present for the history you want while pinning.
Editorial conclusion
Uptrace fits teams that want traces, metrics, and logs in one ClickHouse backed UI and can run two databases plus a collector. Pin an exact pre-release tag, settle AGPL-3.0 exposure, and decide ClickHouse retention yourself before production traffic arrives.
Frequently asked questions
is uptrace free
The license is AGPL-3.0, and the project is positioned as an open source APM you run yourself, with a local Docker example under example/docker/. A hosted cloud demo at app.uptrace.dev/play requires no login. Hosting costs are not stated anywhere in the docs, so check the uptrace.dev pages before assuming a hosted tier is free.
uptrace vs jaeger
Nothing in the project's own docs compares it with Jaeger. What is stated about Uptrace's side is that ClickHouse holds spans, metrics, and logs, PostgreSQL holds metadata such as metric names and alerts, and spans are aggregated with a SQL-like query language while metrics use a Promql-like one.
uptrace vs grafana
They are presented as complementary rather than competing: Grafana can be configured to use Uptrace as a Tempo or Prometheus datasource. Dashboards also come from the other direction, since 50 or more pre-built dashboards are created automatically once metrics start arriving in Uptrace.
uptrace vs sentry
The repository ships Sentry SDK examples rather than a comparison, with example/sentry-browser/, example/sentry-go/, and example/sentry-python/ sitting next to example/django/, example/rails/, and example/vector-logs/. The docs themselves say nothing about Sentry.
uptrace vs prometheus
Uptrace treats Prometheus as an input rather than as its store: OpenTelemetry, Prometheus, Vector, FluentBit, and CloudWatch are all named ingestion paths. Metrics are then aggregated inside Uptrace with a Promql-like language and written to ClickHouse, with metric names kept in PostgreSQL.
uptrace alternatives
Alternatives are not discussed in the docs. The starting points offered are the no login cloud demo at app.uptrace.dev/play, running the example/docker/ compose setup locally, and the getting started guide at uptrace.dev/get.
Official sources
Where this project is recommended
Add this badge to your README
If you maintain this project, the badge below links readers to this analysis and shows its maintenance status from the daily GitHub snapshot. Paste the markdown into your README; add ?metric=license or ?metric=stars to the image URL for a different field.

[](https://hysenlabs.com/projects/uptrace-uptrace)Star history chart for your README
[](https://hysenlabs.com/projects/uptrace-uptrace)Was this useful?