xflr6/graphviz for Python DOT generation and rendering
Simple Python interface for Graphviz
At a glance
- What is it?
- xflr6/graphviz gives Python code a concise interface for constructing DOT graphs, retrieving their source, and invoking the system Graphviz installation. It suits developers who want readable Python graph-building code, but it requires Graphviz outside Python and offers less direct control than bindings to the Graphviz C library.
- Who is it for?
- Choose xflr6/graphviz when Python-based graph construction and readable DOT source are priorities, particularly for documentation, generated diagrams, and notebook workflows. Do not choose it when dependency isolation or direct Graphviz C-library access matters more.
- Can I use it commercially?
- Yes. MIT is a permissive licence: you can use, modify and sell software built on it, as long as you keep its copyright and licence notices.
- Is it still maintained?
- Yes. The repository last received commits 15 days ago.
- What is it written in?
- Mainly Python, according to GitHub's language statistics.
Answers come from the project's GitHub data, last synced on November 7, 2026, and from our analysis. They are not legal advice.
Star history
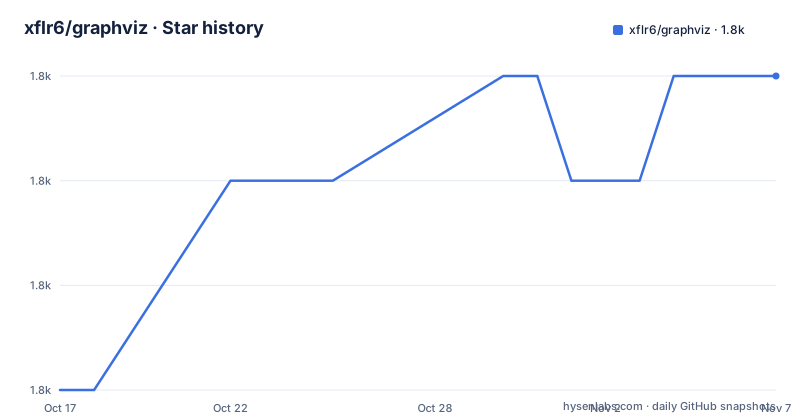
- xflr6/graphviz1,817 ★ · +3
| Repository | 2026-10-17 | 2026-11-07 |
|---|---|---|
| xflr6/graphviz | 1.8k | 1.8k |
3 Stars in the last 21 days, measured from the daily GitHub snapshot. Compare with other projects
Editorial analysis
The Python-side problem xflr6/graphviz addresses
xflr6/graphviz targets developers who want to create Graphviz graphs from Python without assembling DOT syntax as strings throughout an application. Its central objects represent graphs, nodes, and edges. Code can add those elements, attach attributes, inspect the generated `source`, save it, and ask the external Graphviz installation to render it.
The package is particularly relevant for build scripts, documentation tools, generated architecture diagrams, teaching examples, and Jupyter notebooks. The README explicitly documents graph display in Jupyter notebooks and the Jupyter QtConsole. It is also useful when a program needs both graph construction and direct access to DOT source, because `print(dot.source)` exposes the exact representation that will be processed by Graphviz.
This is an interface package rather than a self-contained graphics engine. Python 3.10 or later is required, and rendering also depends on a separate Graphviz installation. The Python package does not eliminate operating-system setup or Graphviz configuration. That separation keeps the Python API small and familiar, but it also means that a successful `pip install graphviz` does not guarantee that `dot.render()` will work.
DOT assembly, subprocess rendering, and output flow
The data flow starts with `graphviz.Digraph(comment='The Round Table')`. Calls such as `node()` add named nodes and attributes, while `edge()` and `edges()` connect them. Reading `dot.source` returns the assembled DOT document, including the comment, graph block, node declarations, edge declarations, and attribute values.
The `render()` method then sends the generated graph through the system Graphviz installation. The README requires the directory containing the `dot` executable to be present on `PATH`. The returned value identifies the generated output, such as `doctest-output/round-table.gv.pdf` in the documented example. This separates Python-side model construction from Graphviz-side layout and file generation.
The `view=True` option adds another step. After rendering, the result can be opened with the operating system's default application. Output can also be represented in formats such as PDF, PNG, or SVG, although the README does not prescribe a single format for every use case. Notebook support adds display-oriented behavior rather than requiring the graph to be opened through a desktop application.
One important boundary is DOT syntax. Backslash escapes and strings resembling `<...>` have special meaning. If node labels or other values come from user input, the README directs developers to the user guide for the exact escaping rules. A Python string can therefore be valid Python while still requiring care before it becomes valid and safe DOT content.
Installing Graphviz and creating the Round Table graph
Install the Python package with the command documented in the README. The `graphviz` name in this command identifies the Python interface, not the separate Graphviz application.
$ pip install graphvizBefore rendering, install Graphviz from its download page and ensure that the directory containing `dot` is on the system `PATH`. The README links installation procedures for Windows and notes that the installer may configure `PATH`. For an Anaconda environment, it also points to the `conda-forge/python-graphviz` package, which should bring in `conda-forge/graphviz` as a dependency.
The first graph can then be built interactively. This code creates a directed graph and adds three labeled nodes:
>>> import graphviz  # doctest: +NO_EXE
>>> dot = graphviz.Digraph(comment='The Round Table')
>>> dot.node('A', 'King Arthur')
>>> dot.node('B', 'Sir Bedevere the Wise')
>>> dot.node('L', 'Sir Lancelot the Brave')
The next fragment connects the nodes and disables the constraint on the final edge, as shown in the README:
>>> dot.edges(['AB', 'AL'])
>>> dot.edge('B', 'L', constraint='false')
Inspecting `dot.source` is the most useful first checkpoint. It should show the named nodes, labels, directed edges, and the unquoted `constraint=false` attribute rather than hiding the generated DOT inside the package.
>>> print(dot.source)Finally, render to a source-named file. This call writes DOT data to the requested `.gv` path and produces the PDF output whose name is returned:
>>> dot.render('doctest-output/round-table.gv').replace('\\', '/')
'doctest-output/round-table.gv.pdf'
A reader working outside the README's doctest environment should not copy the `doctest_mark_exe()` line. For local desktop inspection, add `view=True` to `render()`.
Jupyter use and concrete operational constraints
The documented repository includes examples for notebook display and engine selection, including `examples/graphviz-notebook.ipynb`, `examples/graphviz-engines.ipynb`, and files covering escapes and Jupyter formatting. These examples indicate that rendering integration is a considered use case rather than an incidental claim.
For notebook work, the same graph-building model applies: import `graphviz`, construct a graph object, and invoke its display or rendering behavior. The README does not provide a universal one-line command that must be copied into every notebook, so an engineer should follow the linked notebook example and the documentation version that matches the installed package. This lack of a single recipe in the README is worth noting, because notebook environments can combine Python packages, Graphviz system binaries, display backends, and file permissions.
The package advertises Python support for versions 3.10 through 3.14 in `pyproject.toml`, with a minimum requirement of `>=3.10`. The README installation instructions are correspondingly narrow: Python 3.10 or later. The project metadata also marks the distribution as `Development Status :: 4 - Beta`, which is a packaging classification rather than evidence about an individual installation.
For a server deployment, the `.gv` source and rendered output are both file-based artifacts in the documented example. The README does not promise in-memory rendering, a browser-independent preview, or automatic cleanup. Teams should therefore avoid assuming that `render()` fits a container that lacks `dot`, or that `view=True` is suitable for a headless service.
The main failure mode is an invalid or unavailable rendering environment
The clearest operational failure is a Python installation without a usable Graphviz executable. The package can still assemble a graph and return `dot.source`, but rendering depends on `dot` being discoverable through `PATH`. A missing executable, a platform-specific installation problem, or a service account with a different environment can therefore produce a graph-building stage that succeeds and a rendering stage that fails.
The second failure mode involves data escaping. DOT treats backslashes and angle-bracket-like text specially. Passing arbitrary user input directly into labels can produce output that does not represent the intended literal string. The README does not claim that automatic handling removes this concern; instead, it points to the user guide. This makes xflr6/graphviz suitable for code that can define or validate its labels, but it requires extra care for a service that accepts graph text from untrusted users.
It is also the wrong tool when the application needs low-level access to Graphviz internals rather than a simple Python graph object. The README lists pygraphviz as a full interface wrapping the Graphviz C library with SWIG and graphviz-python as the official Python bindings. Those choices have a different dependency and control model. xflr6/graphviz is more appropriate when the goal is concise graph assembly, inspectable DOT, and straightforward delegation to the system Graphviz tools.
Alternatives, maintenance signals, and upgrade boundaries
pydot is the README's pure-Python alternative, with a pyparsing dependency. It offers a different route for creating and manipulating graph descriptions without installing the Graphviz executable for the Python-side model. However, rendering still needs a Graphviz installation when output files are required, so switching libraries does not automatically solve system-level rendering.
pygraphviz takes a lower-level approach by wrapping the Graphviz C library through SWIG. That can be a better fit for code that needs broader control over the Graphviz API, but it introduces a different build and dependency profile. The official graphviz-python bindings are another documented alternative and connect Python with Graphviz through the project's own binding interface. xflr6/graphviz distinguishes itself by offering a small Python-facing API whose primary flow is object construction, DOT source generation, and external rendering.
The repository is not archived, and its last push was on 2026-07-11. That is recent activity in the repository record, but the README does not promise a particular release cadence. The repository has no GitHub releases, while `CHANGES.rst` and the online changelog are the documented places for change history. Upgrade planning should account for the minimum Python version, the separately installed Graphviz version, and the possibility that rendering behavior depends on the system executable rather than only on the Python package. The MIT license permits use, modification, distribution, and sublicensing subject to its notice and conditions, but organizations should inspect the license text for their compliance process.
Editorial conclusion
Choose xflr6/graphviz when Python-based graph construction and readable DOT source are priorities, particularly for documentation, generated diagrams, and notebook workflows. Do not choose it when dependency isolation or direct Graphviz C-library access matters more. Before adoption, verify that the system Graphviz `dot` executable is available on `PATH`, decide how untrusted strings will be escaped according to the user guide, and confirm that the selected output format works in the target deployment environment.
Frequently asked questions
How do I install xflr6/graphviz?
The README documents `pip install graphviz` for Python 3.10 or later. Rendering also requires a separate Graphviz installation, with the directory containing `dot` on `PATH`.
How do I create and render a graph with xflr6/graphviz?
Create a `Digraph`, add nodes with `node()` and connections with `edge()` or `edges()`, inspect `dot.source`, then call `render()`. The README example uses `render('doctest-output/round-table.gv')` and returns the generated PDF path.
Can xflr6/graphviz display graphs in Jupyter?
Yes, according to the README, graphs can be rendered and displayed in Jupyter notebooks and the Jupyter QtConsole. The repository also includes `examples/graphviz-notebook.ipynb`.
Official sources
Add this badge to your README
If you maintain this project, the badge below links readers to this analysis and shows its maintenance status from the daily GitHub snapshot. Paste the markdown into your README; add ?metric=license or ?metric=stars to the image URL for a different field.

[](https://hysenlabs.com/projects/xflr6-graphviz)Star history chart for your README
[](https://hysenlabs.com/projects/xflr6-graphviz)Was this useful?