geobr: official Brazilian spatial data for R, Python and QGIS
Easy access to official spatial data sets of Brazil in R and Python
At a glance
- What is it?
- geobr is the package from IPEA for the official spatial data sets of Brazil and it exists to make that data usable without a GIS specialist: one function call downloads a boundary, a region or a mesh with harmonized attributes, a fixed projection and consistent topology across years. It ships as an R package on CRAN, a Python package on PyPI, and a QGIS plugin, all from the same repository.
- Who is it for?
- Adopt geobr when your work needs Brazilian administrative or statistical geography and you want the official version rather than a cleaned-up copy, because the harmonised attributes and fixed topology are the whole value of the package and a general purpose geodata downloader will not give you either.
- Can I use it commercially?
- Not without permission. GitHub finds no licence file in the repository, and without a licence all rights are reserved by default: you may read the code but not reuse it. Check the README, or ask the authors, before using it.
- Is it still maintained?
- Yes. The repository last received commits 13 days ago.
- What is it written in?
- Mainly Python, according to GitHub's language statistics.
Answers come from the project's GitHub data, last synced on November 7, 2026, and from our analysis. They are not legal advice.
Star history
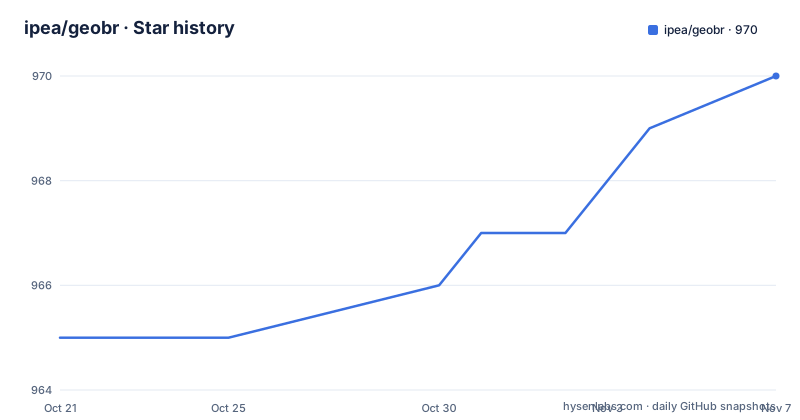
- ipea/geobr970 ★ · +5
| Repository | 2026-10-21 | 2026-11-07 |
|---|---|---|
| ipea/geobr | 965 | 970 |
5 Stars in the last 17 days, measured from the daily GitHub snapshot. Compare with other projects
Editorial analysis
A research institute publishing its own geodata
geobr is a computational package to download official spatial data sets of Brazil, and the phrase official is doing the work. The repository and package are hosted under the ipea organisation with a documentation site at ipea.github.io/geobr.
That provenance is the reason the package exists at all. The raw data is published in formats that suit a GIS specialist and a public agency, with different attribute names between years, projections that vary by source, and boundaries that change between releases. A user who wants, say, the municipalities of a state as a machine-readable table with one column per year has to reconcile all of that by hand every time.
The package's answer is stated in the README in three terms. The data sets are available at various geographic scales and for various years. They come with harmonized attributes, which is the promise that the same concept has the same column name and meaning across the whole set. They have a fixed projection, so that layers from different data sets line up with each other. And they have fixed topology, so that a boundary shared by two regions is the same geometry in both, with no gaps or overlaps when you combine them.
Those three properties are what turn a collection of official files into something you can analyse, and they are also what distinguishes this from a convenience downloader. Harmonisation, a common projection and clean topology are properties of the published package, not of the source, and they are the reason the documentation goes to the length it does about the data sets available, with a detailed list referenced in the README and hosted on the project site.
The scope is Brazil. That is not a limitation to apologise for, it is the design, and it is why the package is maintained by the institute that produces the data rather than by a general purpose geospatial utility.
One repository, three ways to use it
The repository layout tells the story of the delivery strategy:
r-package/
python-package/
qgis-plugin/
docs/
templates/
quality_reports/
The same data set is reachable from R, from Python and from QGIS, and all three come out of the same tree, which means the harmonisation work is done once and reused three times rather than reimplemented per language. For a research institute that has users in three different communities, that is the only way the effort stays maintainable.
The R package is on CRAN, with a release version badge, a download badge, a test coverage badge and a build status badge, and it carries the tidyverse lifecycle badge marking it as stable. The Python package is on PyPI with its own version badge, download counts, coverage badge and a build status badge, and it carries the same lifecycle badge.
The QGIS plugin is the third front end, and it is the one that matters for people who do not write code. A large share of the people who need Brazilian municipal boundaries are doing exploratory work in a desktop GIS, and a plugin that pulls the official layer into the project directly, with the same attribute names, saves a conversion step and the errors that come with it.
The quality_reports directory is worth noticing as well, because it suggests the project treats the data itself as something to be checked rather than something to be passed through. The codecov configuration at the root and the per-language coverage badges indicate that both packages are tested, and the templates directory holds the scaffolding used for those checks.
The repository also carries a CONDUCT.md, a CONTRIBUTING.md and a CLAUDE.md alongside a MEMORY.md and a.claude directory, which is the convention for a project that expects work from AI coding assistants, and the older.travis.yml and appveyor.yml files show the continuous integration history of a project that has been running for a while.
Installing the R package, and the Linux caveat
The R install is the standard one from CRAN, with a documented path to the development version:
``` r # From CRAN install.packages("geobr")
# or use the development version with latest features utils::remove.packages('geobr') remotes::install_github("ipea/geobr", subdir = "r-package") ```
Two details in that snippet are worth noticing. The development route names the r-package subdirectory, because the repository root is not an R package and the install has to be told where the package lives. And the development route removes the CRAN version first, so that you are not left with two copies of geobr in your library, which is a mistake that produces confusing errors when the loaded version is not the one you expect.
The Linux caveat is stated right after the install, and it is a real one. On Linux you need to install a couple of dependencies before installing the libraries sf and geobr, with a link to the sf documentation for the details. That is not a quirk of geobr itself. It comes from sf, the R spatial library geobr builds on, which needs system level geospatial libraries, and on Linux those are not present by default while on Windows and macOS they are usually handled by a binary distribution. The practical advice is to install the system dependencies first, and to read the sf instructions rather than trying to compile and guessing at the error.
For a package that a research pipeline depends on, the CRAN route is the one to use, because a versioned release from a repository is reproducible, while the GitHub route tracks whatever is on the branch.
Python, uv and the same data in a different idiom
The Python package is on PyPI under the name geobr, and the README names uv as the recommended installer, with the installation section pointing at the uv documentation. The Python half of the project therefore targets a current toolchain rather than the older conventions, and the same repository is shared with the R package and the QGIS plugin, so the two language implementations are expected to stay in step.
The Python ecosystem conventions in the repository are visible in the topic list, which names geopandas, geoparquet, geopackage, shapefile and sf alongside python, r, rstats and qgis-plugin. That combination is the shape of a modern Python geospatial stack, and the presence of geoparquet and geopackage in the topics is a signal about the delivery formats the project cares about: the newer columnar and transactional formats rather than only the shapefile.
That matters more than it might sound. A shapefile has hard limits, a fixed set of attributes limited to ten characters per field name, and a well known problem with encoding for non-Latin characters, which matters for a country whose place names include accents. A package that publishes the same layer in several formats lets the user choose, and choosing is part of the value of the harmonisation work.
The Python side is a first class citizen rather than a port, with its own package index entry, its own build checks and its own coverage reporting, and with uv named as the recommended way to install.
Why harmonisation is the product
It is easy to look at geobr as a convenience wrapper around a set of download URLs, and it is worth being clear about why that would undersell it.
Official government geodata is published for administrative and statistical use, not for analysis. The same region appears in successive years with different codes, because the codes are assigned by the institute and the boundaries change as the country is divided. A municipality that is created is split from others, and the neighbouring municipalities change shape with it. Attribute names change between editions, sometimes because a label was shortened, sometimes because a concept was renamed. Projections differ between agencies. The result is that a multi-year analysis of Brazilian geography is a data engineering project before it is an analysis project, and that engineering is repeated by every user.
geobr absorbs that work. The harmonized attributes mean a year of data can be stacked on another year without a translation table. The fixed projection means layers from different data sets overlay without a reprojection step and without the errors that come from assuming a projection that is not stated in the file. The fixed topology means that a municipality boundary shared with its neighbour is identical in both, so a coverage or adjacency calculation does not have to deal with slivers and gaps that a naive concatenation would introduce.
That last one is the property with the longest reach, because topology errors do not announce themselves. A small gap between two polygons produces a plausible looking number, and the number is wrong, and the error propagates into every aggregate built on it. Fixing that once, in the published data, is the difference between a package that downloads files and a package that produces analysable data.
It also explains the emphasis on various geographic scales and various years in the README. A package that only published one layer would be a download script. A package that publishes the same hierarchy, municipalities, states, regions and whatever else the institute defines, for a range of years, with the attributes and the geometry consistent across all of it, is a data product, and that is what the documentation is for.
Release cadence, governance and the boundary of the data
The release history shows a project on a regular version cycle. Version 2.0.0 came out on 2026-05-20, 2.0.1 on 2026-06-23 and 2.1.0 on 2026-09-20. A major version in May, a patch in June and a minor in September is the shape of an actively maintained package with a breaking change in the middle of the year, and the repository status badge describes the project as having reached a stable, usable state and being actively developed.
The repository is not archived and the last push was on 2026-10-10, close to the current date. The 2.0 release is the one to look at before you build on this, since a major version in a package like this usually means the function signatures or the data layout changed, and code written against 1.x will need attention.
What geobr is not is unlimited by its own nature. It covers Brazil, so a project that needs a multi-country dataset will need something else for the rest of the world, and the harmonisation guarantees it makes are about Brazilian data sets and their relationship to each other. It is also only as current as the institute's publications, which is a constraint rather than a defect, but it does mean a pipeline that needs yesterday's boundaries is looking at the wrong tool.
The last boundary is the one that catches people: the data is official, and official data is a political and administrative artefact. The boundaries in the package are the ones the institute publishes, and they change for reasons that are administrative rather than geographic. Any analysis that treats a municipality as a stable geographic object is making an assumption the package does not make.
For a project that needs Brazilian geography with the housekeeping already done, this is the reference implementation, and the fact that it comes from the institute that produces the data is what makes the harmonisation credible rather than merely plausible.
Editorial conclusion
Adopt geobr when your work needs Brazilian administrative or statistical geography and you want the official version rather than a cleaned-up copy, because the harmonised attributes and fixed topology are the whole value of the package and a general purpose geodata downloader will not give you either. It is the wrong tool for any country other than Brazil, and it is the wrong tool if you need data that is more recent than the last official publication, since a package cannot invent geography the institute has not published. Before building a pipeline on it, pin the version, because the 2.0 release changed the interface, and check the documentation for the list of data sets and the years each one covers.
Frequently asked questions
What does the geobr package do?
It downloads official spatial data sets of Brazil at various geographic scales and for various years, with harmonized attributes, a fixed projection and fixed topology. It is available as an R package on CRAN, a Python package on PyPI and a QGIS plugin.
Who maintains geobr and where does the data come from?
The package is maintained under the ipea organisation, and the documentation site is at ipea.github.io/geobr. The repository carries a stable lifecycle badge in both language implementations and a repository status badge marking the project as actively developed.
How do I install geobr in R?
From CRAN with install.packages("geobr"). For the development version the README uses remotes::install_github("ipea/geobr", subdir = "r-package"), after removing the CRAN copy so that only one version is loaded.
Why does installing geobr in R fail on Linux?
Because the spatial library sf, which geobr builds on, needs system level geospatial dependencies that are not installed by default on Linux. The README tells you to install a couple of dependencies first and links to the sf documentation for the details.
What does fixed topology mean for the data geobr returns?
It means that a boundary shared by two regions is the same geometry in both, so combining layers produces no gaps, slivers or overlaps. That matters because topology errors do not announce themselves in a coverage or adjacency calculation, they produce plausible but wrong numbers.
Official sources
Add this badge to your README
If you maintain this project, the badge below links readers to this analysis and shows its maintenance status from the daily GitHub snapshot. Paste the markdown into your README; add ?metric=license or ?metric=stars to the image URL for a different field.

[](https://hysenlabs.com/projects/ipea-geobr)Star history chart for your README
[](https://hysenlabs.com/projects/ipea-geobr)Was this useful?